Fig. 2.
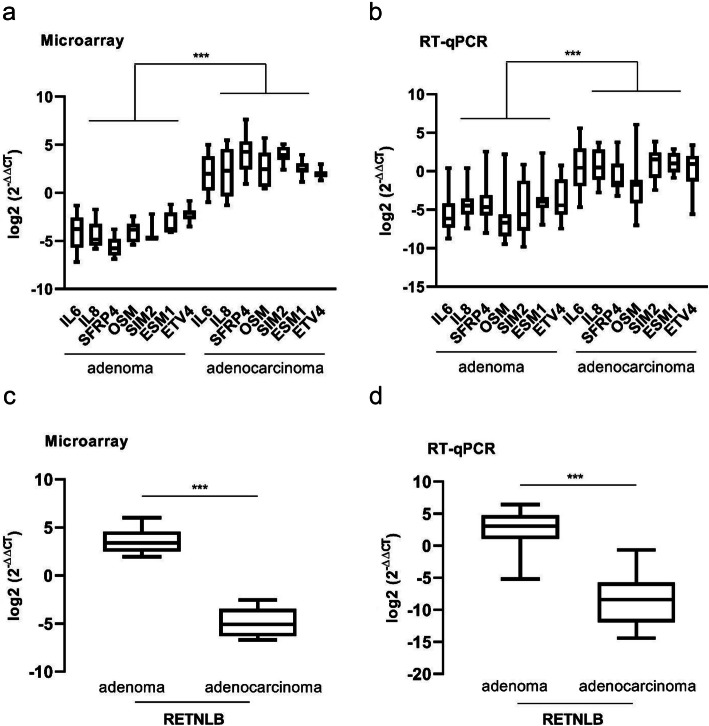
Validation of microarray data by RT-qPCR. a Microarray data of the 10 paired adenoma/adenocarcinoma paired samples, showing the upregulation of seven genes in adenocarcinomas compared to adenomas. b RT-qPCR results showing the validation of the microarray results of the same set of genes in a larger set of samples (25 adenoma and 16 adenocarcinoma samples, of which 10 adenoma/adenocarcinoma paired samples and 15 adenoma and 6 adenocarcinoma additional new samples). c and d Relative expression of the RETNLB gene found downregulated in adenocarcinomas when compared to adenomas by microarray (10 paired adenoma-adenocarcinoma samples) and RT-qPCR (10 adenoma/adenocarcinoma paired samples plus 15 adenoma and 6 adenocarcinoma samples) analysis, respectively. Fold changes (log2 FC) between the expression means in adenomas and adenocarcinomas were A = 6.75, B=4.93, C=8.50 and D=11.12. Mann-Whitney’s test was used for statistical analysis (A and B: ***p < 0.0006; C and D: ***p < 0.0001)

