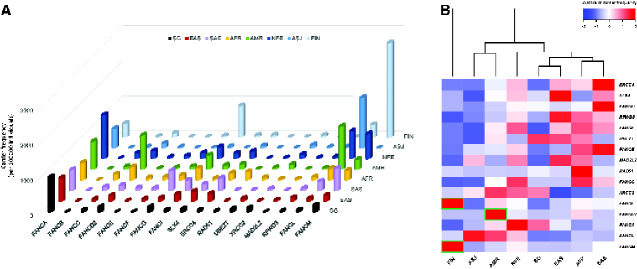
Figure 1.
Frequency of potentially pathogenic germline variant carriers in 17 Fanconi anemia (FA) genes across ancestry groups. (A) Carrier frequency (per 100 000 individuals) aggregated for each of the 17 FA genes visualized for Singaporeans (SG) and 7 selected ancestry groups from gnomAD. (B) Heatmap of normalized carrier frequencies in the 8 populations for each FA gene. The dendrogram represents hierarchical clustering of the columns based on Euclidean distance. Pairwise differences in proportion were evaluated by Fisher’s exact test, with Bonferroni correction for multiple testing (448 tests). Adjusted P < .05 was considered statistically significant, with green boxes indicating ancestry groups with carrier frequencies statistically significantly higher than all other compared groups. Color scale represents row-wise Z-scores of carrier frequencies. AFR = African American; AMR = admixed-American or Latino; ASJ = Ashkenazi Jewish; EAS = East Asian; FIN = Finnish European; NFE = non-Finnish European; SAS = South Asian.

