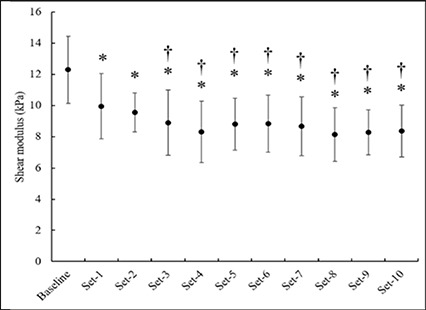
Figure 3.

Shear modulus of pectoralis minor muscle during repeated stretching. The black dots and error bars represent mean values and standard deviation respectively. The asterisk means that the shear modulus is significantly lower than that of Baseline. The dagger indicates that the shear modulus is significantly lower than that of Set-1.
