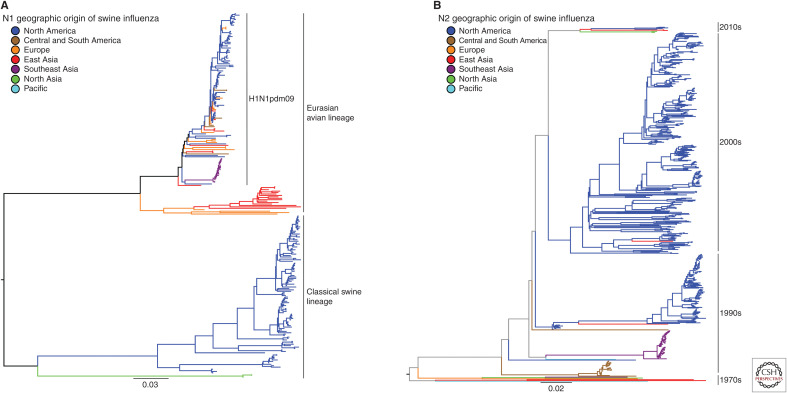
Figure 2.
The major N1 and N2 neuraminidase genetic lineages and geographic distribution of contemporary influenza A virus in global swine. (A) The best-known tree was inferred using maximum likelihood methods for 255 swine N1 NA sequences collected globally from 2016 to September 2019 and from the United States from March 2019 to September 2019; and (B) 552 swine N2 NA sequences collected globally from 2016 to September 2019, and from the United States from March 2019 to September 2019. Branch color represents geographic groups and include North America with data from Canada and United States; Central and South America with data from Argentina, Brazil, and Chile; Europe with data from Czech Republic, France, Germany, Italy, and Spain; East Asia with data from China, Japan, and South Korea; Southeast Asia with data from Thailand and Vietnam; North Asia with data from Russia; and the Pacific with data from Australia. The lineage of N1 NA is indicated by solid black lines on the right of the tree in A. The decade of introduction of human seasonal N2 NA gene into swine populations is indicated by solid black lines on the right of the tree in B (e.g., the 1970s includes the introduction in Europe, the 2000s includes the 2002 lineage in North American swine, etc.); the trees are midpoint-rooted for clarity; branch lengths are drawn to scale; and the scale bars indicate the number of nucleotide substitutions per site.

