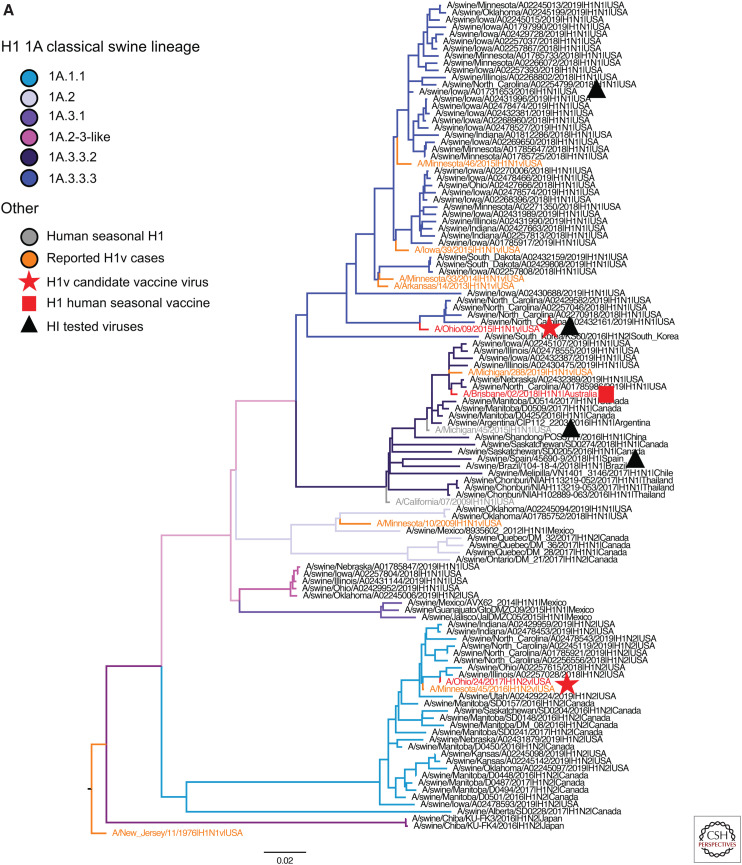
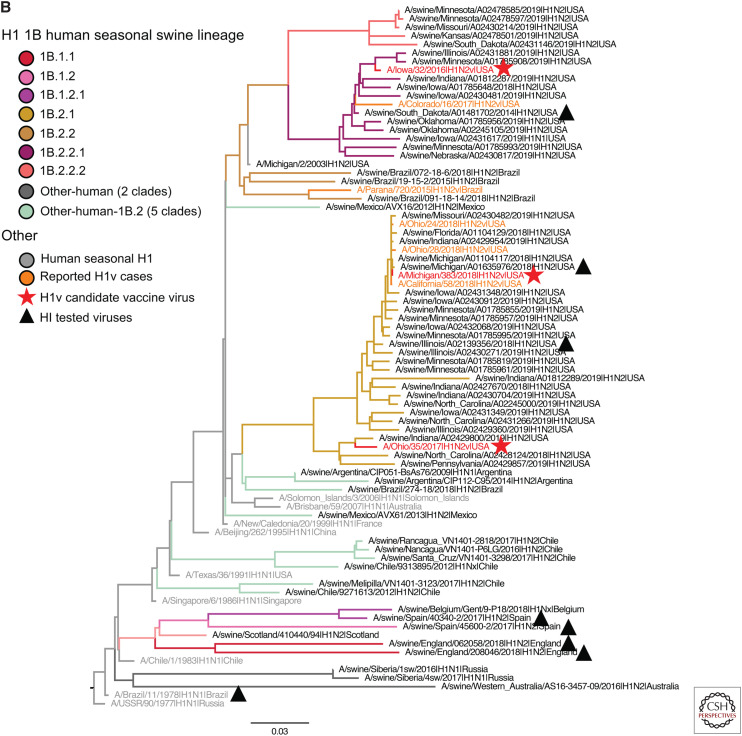
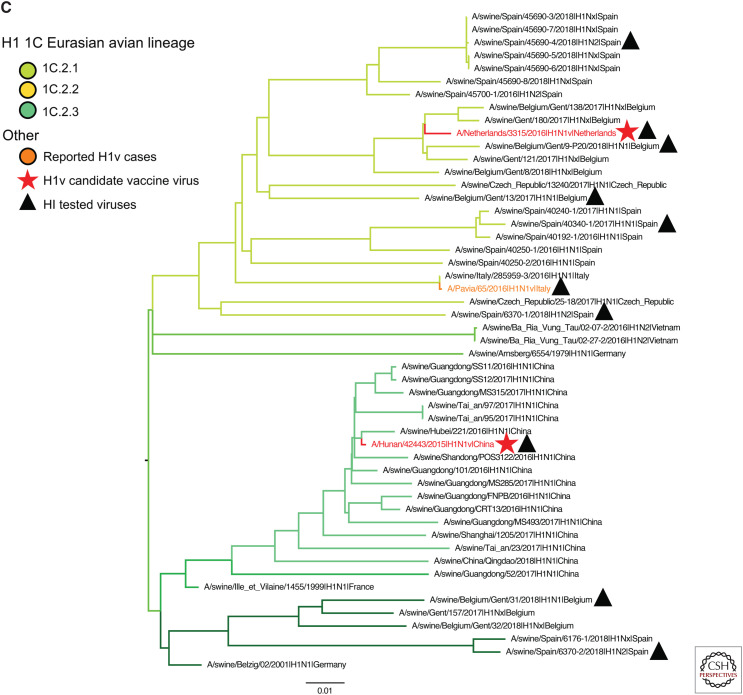
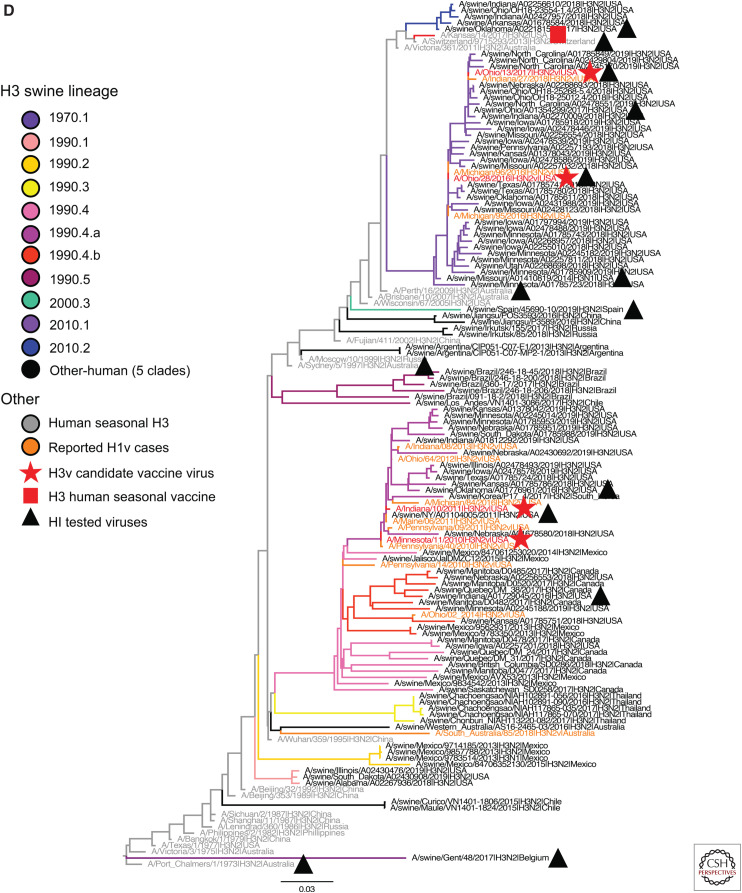
Figure 3.
H1 and H3 influenza A virus hemagglutinin phylogenetic lineages of contemporary influenza A virus in global swine. The trees were inferred using maximum likelihood methods for randomly subsampled HA gene sequences, maintaining proportional representation of swine clades detected in the United States from March 2019 to September 2019 and from remaining global countries from 2016 to September 2019. (A) The 1A classical swine lineage; (B) 1B human seasonal lineage; (C) 1C Eurasian avian lineage; and (D) H3 swine lineages. Branch color represents swine genetic clade; reported human variant strain names are colored in orange; candidate vaccine virus strains are indicated by a red star; H1 and H3 human seasonal vaccine strains by a red square; and strains tested by hemagglutination inhibition assays as antigen or antisera by a black triangle. The trees are midpoint-rooted for clarity; branch lengths are drawn to scale; and the scale bars indicate the number of nucleotide substitutions per site.


