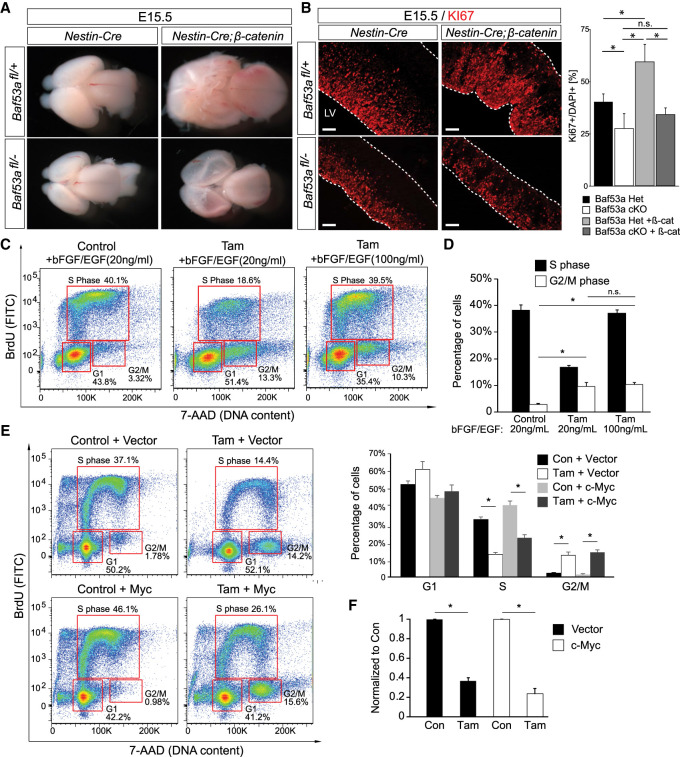
Figure 3.
Intrinsic and extrinsic drivers of NSPC proliferation cannot rescue proliferation defects resulting from Baf53a deletion. (A) Photomicrographs of whole brains from BAF53a mutant or control embryos with and without the β-catenin transgene at E15.5. (B) Immunofluorescence staining for the proliferation marker KI67 on E15.5 sagittal sections through the cortex of BAF53a mutant or control embryos with and without the β-catenin transgene, respectively. Scale bar, 100 µm. Quantification of the percentage of KI67+/DAPI+ cells in the four genotypes. n = 3–5 embryos per genotype. Data presented as mean ± SEM. (*) P < 0.05, one-way ANOVA and post-hoc Tukey's test for multiple comparisons. (C) Cell cycle FACS analysis of Actin-CreER; Baf53afl/− neurospheres upon BrdU incorporation with and without tamoxifen (Tam) treatment and following application of increasing concentrations of the growth factors bFGF and EGF. (D) Quantification of the mitogens’ effects on cell cycle in the context of Baf53a deletion. n = 3. Error bars represent SEM. (*) P < 0.05. (E) Cell cycle FACS analysis depicting the effect of c-Myc overexpression in Actin-CreER; Baf53afl/− neurospheres with and without tamoxifen. Cells were infected with either empty vector virus or c-Myc virus and selected by hygromycin prior to tamoxifen treatment for 72 h. n = 3. Error bars represent SEM. (*) P < 0.05. (F) Quantification of total cell numbers 72 h after tamoxifen treatment (normalized to condition treated with EtOH). n = 3. Error bars represent SEM. (*) P < 0.05.

