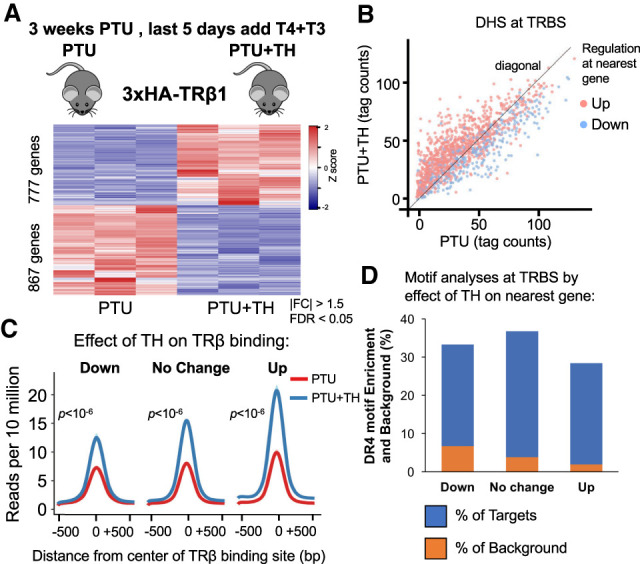
Figure 2.

TRβ binding sites near genes that are induced or repressed by TH. (A) Heat map showing TH-dependent differentially regulated genes. n = 3 biological replicates, DE cutoff: |FC| > 1.5, two-sided Benjamini–Hochberg-adjusted FDR < 0.05 as determined by edgeR likelihood ratio test. (B) Scatter plot of DNase-seq data showing read counts centered to TRBSs from PTU-treated mice against PTU + TH-treated mice (n = 2 biological replicates). (Red) Up-regulated, (blue) down-regulated. DE cutoff taken from A. (C) Average density profiles in reads per 10 million of TRβ ChIP-seq data (n = 3 biological replicates) at TRBSs in PTU- or PTU + TH treated mice. TRBSs were categorized by the effect of TH on the nearest gene annotated to them. (D) DR4 motif enrichment (percentage) depicted as blue bars for each TRBSs group, categorized by the effect of TH on the nearest gene annotated to them. The orange bars overlay showing the (percentage) background level (Homer used for de novo motif search).
