Figure 3.
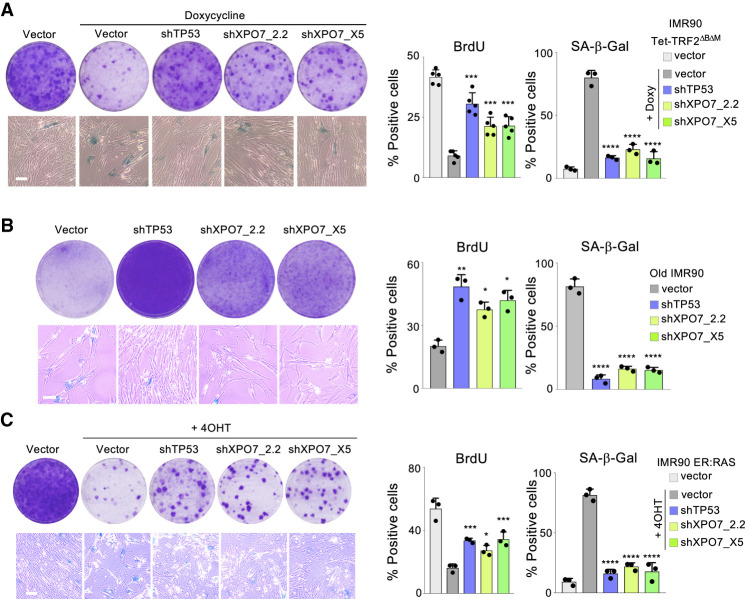
XPO7 depletion prevents senescence. (A) TRF2ΔBΔM-induced senescence. Representative images of colony formation assay (crystal violet, top left) and SA-β-galactosidase (bottom left) in IMR90 Tet-TRF2ΔBΔM cells infected with the indicated vectors. Quantification of the percentage of BrdU-positive (middle, n = 5 independent experiments) and SA-β-galactosidase-positive (right, n = 3 independent experiments) cells. (B) Replicative senescence. Representative images of colony formation assay (crystal violet, top left) and SA-β-galactosidase (bottom left) in old IMR90 cells (passage 24) infected with the indicated vectors. Quantification of the percentage of BrdU-positive (middle) and SA-β-galactosidase-positive (right) cells (n = 3 independent experiments). (C) Oncogene-induced senescence. Representative images of colony formation assay (crystal violet, top left) and SA-β-galactosidase (bottom left) in IMR90 ER:RAS cells infected with the indicated vectors. Quantification of the percentage of BrdU-positive (middle) and SA-β-galactosidase-positive (right) cells (n = 3 independent experiments). All scale bars, 50 µm. (****) P < 0.0001, (***) P < 0.001, (**) P < 0.01, (*) P < 0.05. All statistical significances were calculated using one-way ANOVA with multiple comparison with control senescent cells for each condition.

