Figure 5.
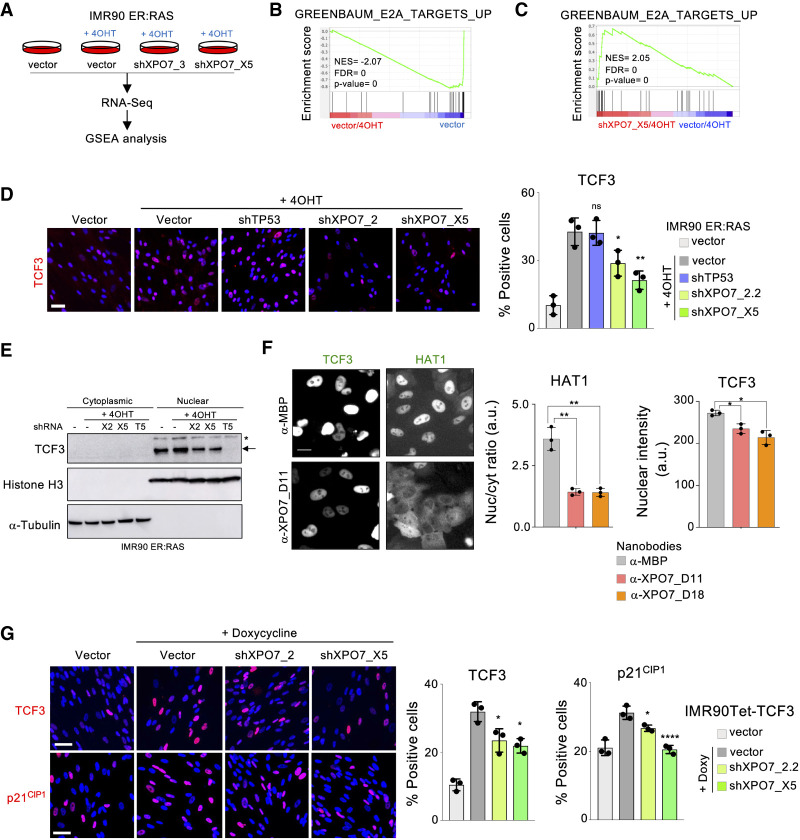
XPO7 regulates nuclear levels of TCF3 to control senescence. (A) RNA sequencing (RNA-seq) was performed with IMR90 ER:RAS cells transduced with the indicated vectors. When noted, 4OHT was added to induce OIS. Data were subjected to gene set enrichment analysis (GSEA). (B,C) GSEA showing depletion of a signature associated with the knockdown of TCF3 target genes (Greenbaum_E2A_targets_up) during OIS (vector/4OHT vs. vector) (B) and its enrichment in cells undergoing senescence infected with XPO7 shRNAs (shXPO7_X5/4OHT vs. vector/4OHT) (C). (NES) Normalized enriched score, (FDR) false discovery rate. (D) XPO7 prevents nuclear TCF3 accumulation during OIS. IMR90 ER:RAS cells were transduced with the indicated vectors and treated with 4OHT where indicated to induce OIS. Representative pictures of TCF3 IF (left) and quantification (right) are shown (n = 3 independent experiments). (**) P < 0.01, (*) P < 0.05, (n.s.) nonsignificant. All statistical significances were calculated using one-way ANOVA with multiple comparisons with control senescent cells for each condition. All error bars represent mean ± SD. (E) Immunoblot to analyze the distribution of TCF3 in cytosolic and nuclear fractions. IMR90 ER:RAS cells were transduced with shRNAs targeting XPO7 ([X2] XPO7_2.2; [X5] XPO7_X5), TCF3 ([T5] TCF3_G5) or a nontargeting control (−). Senescence was induced in IMR90 ER:RAS cells by adding 4OHT where indicated. An arrow indicates the correct band for TCF3, while the asterisk indicates a nonspecific band. Histone H3 and α-tubulin were used as markers for the nuclear and cytosolic fractions, respectively. (F) GFP-fused TCF3 or HAT1 were transfected in HeLa cells together with nanobodies recognizing MBP or XPO7. IF was conducted to assess their subcellular localization. (Left) Representative pictures are shown. Scale bar, 20 μm. Nuclear/cytoplasmic GFP ratio for GFP-HAT1 (middle) and nuclear intensity for TCF3-GFP (right) are shown (n = 3 independent experiments). (**) P < 0.01, (*) P < 0.05. All statistical significances were calculated using an unpaired two-sided t-test. (G) Inducible expression of TCF3. IMR90 Tet-TCF3 cells were transduced with shRNA targeting XPO7 or a nontargeting control (vector) and treated with 100 ng/mL doxycycline to induce TCF3 expression. (Left) Representative pictures of TCF3 (top) and p21CIP1 (bottom) immunofluorescence. Scale bars, 50 µm. (Right) Quantification from n = 3 independent experiments. (****) P < 0.0001, (*) P < 0.05. Statistical significance was calculated using one-way ANOVA with multiple comparisons with control senescent cells. All error bars represent mean ± SD.

