
Figure 2.
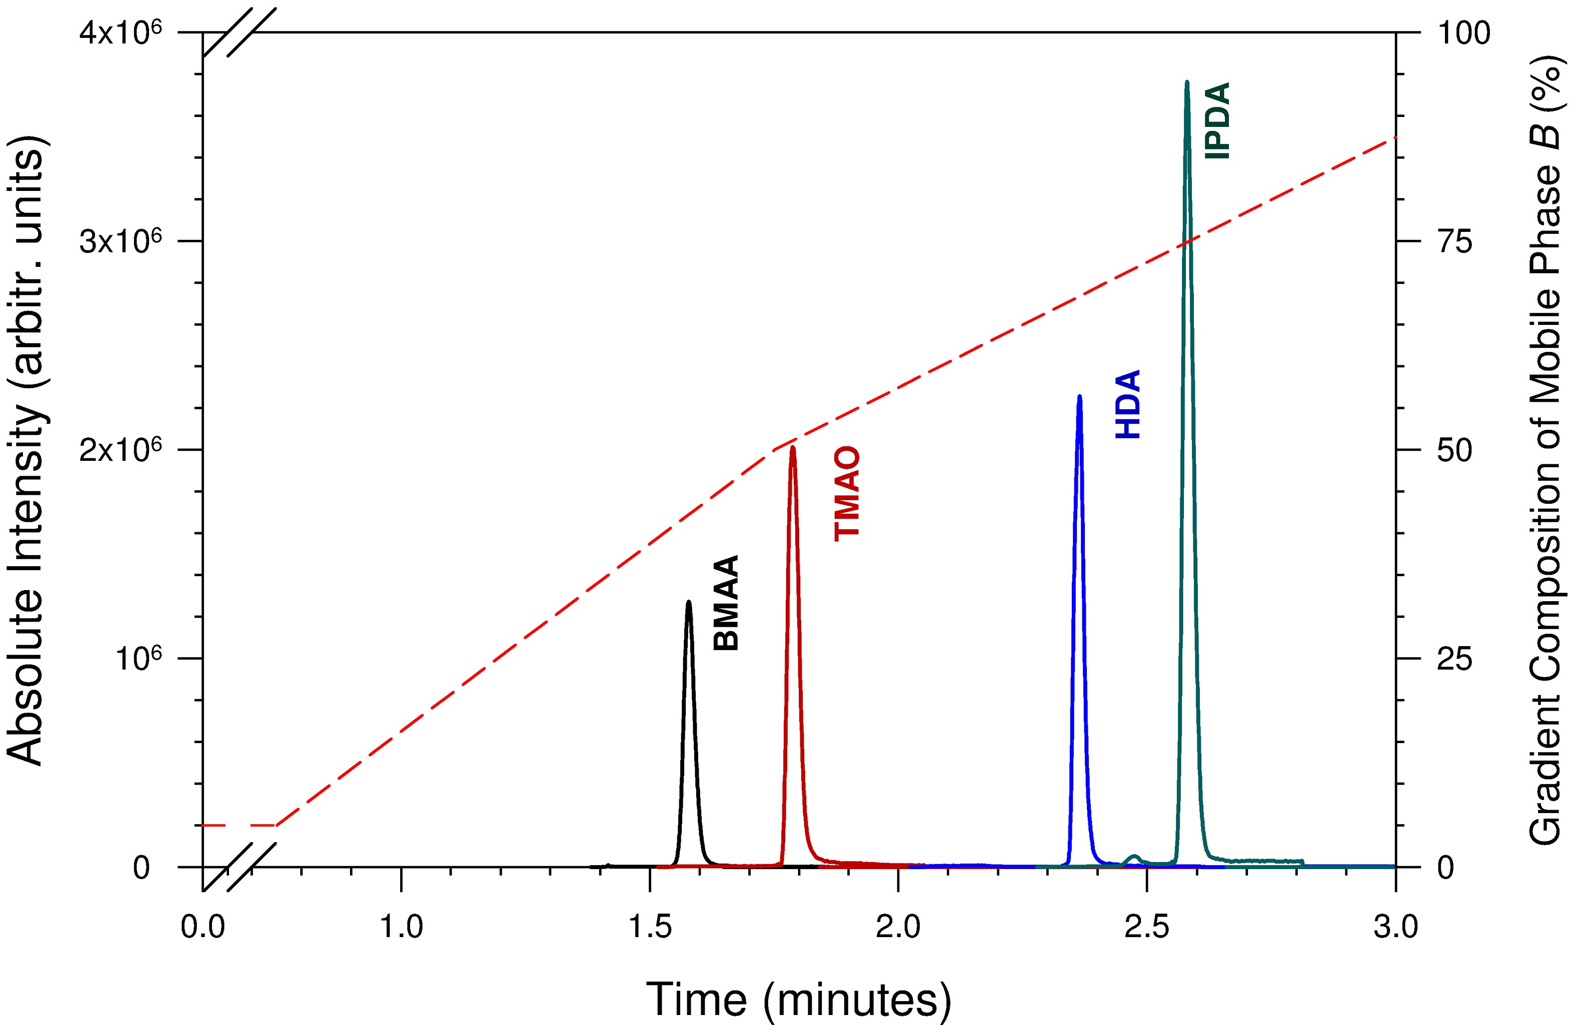
Representative extracted-ion chromatograms of BMAA, TMAO, HDA, and IPDA prepared in 0.1% (v/v) HFBA in water at arbitrary concentrations (non-equimolar) using HFBA and a reversed-phase column. The dotted line represents percentage composition of mobile phase B (right y-axis) against retention time (x-axis). The gradient profile does not illustrate the change in flow rate shown in Table 1.