Figure 3.
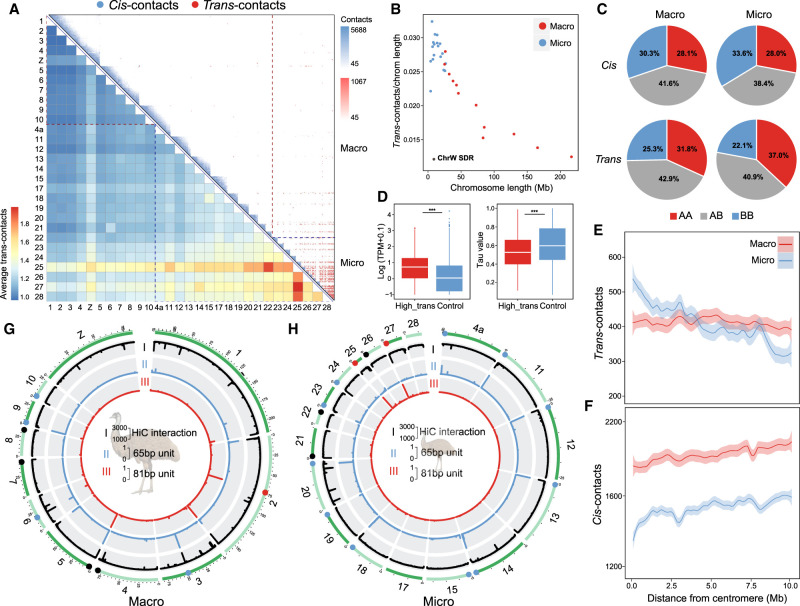
3D chromatin contacts of macro- and microchromosomes. (A) Upper right panel: each blue triangle shows the cis-contacts of each chromosome measured by the numbers of Hi-C reads connecting any of the two 40-kb regions of the same chromosome. Microchromosomes exhibit more frequent trans-contacts measured by the number of Hi-C reads connecting any of the two 40-kb regions of two different chromosomes. The color is scaled to the contact strength, that is, the Hi-C read numbers. The lower left heat map shows the chromosome-wide average strength of trans-contacts between any of the two chromosomes. The dashed lines demarcate macro- and microchromosomes. (B) Microchromosomes show more trans-contacts than macrochromosomes, after being scaled by chromosome size, and the SDR of Chr W (black dot) shows very few trans-contacts. Each dot represents one chromosome (blue for microchromosomes, red for macrochromosomes). (C) Comparing different types of contacts connecting two active compartments (AA), two inactive compartments (BB), or active and inactive compartments (AB) between macro- and microchromosomes. (D) Genes that are overlapped with any of the 40-kb windows exhibiting the top 10% high levels of trans-contacts (‘High_trans’) have significantly higher expression levels and lower tau values (the lower the tau value is, the broader tissue expression the gene has) than the other genes, suggesting these are likely housekeeping genes. (***) P < 0.0005. (E,F) The average distributions of trans- or cis-contacts along the chromosomes with the distance away from the centromeres, suggesting centromeres have more impacts on the trans-contacts of microchromosomes than those of macrochromosomes. (G,H) From the outer to inner circles: (I) Hi-C contacts where the black lines indicate the punctuation of such contacts; (II) genomic distribution of 65-bp putative centromeric repeats (blue); (III) genomic distribution of 81-bp (red) centromeric repeats. The putative centromeres were annotated by one or two of these three sources of information, corroborated with karyotype information, and then color-coded accordingly on the chromosomes.

