Figure 1.
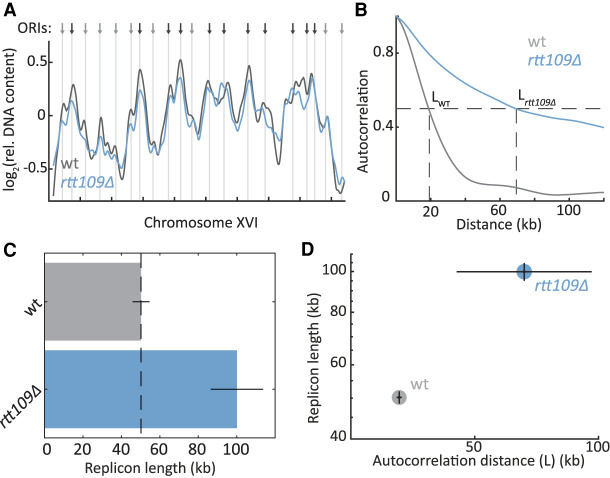
DNA replication in the absence of the Rtt109 acetyl transferase. (A) RTT109 deletion affects the replication profile: The relative DNA abundance along Chromosome XVI is plotted for wild-type (wt; gray) and rtt109Δ (blue) strains. Arrows and vertical lines indicate ORIs, as defined by OriDB (Yabuki et al. 2002): black, early; gray, late. (B–D) RTT109 deletion increases replicon length: Shown is the autocorrelation (B), calculated over the full replication profiles, and replicon length (C), calculated through principal component analysis, for wt (gray) and rtt109Δ (blue) strains. The distance at which the autocorrelation reaches half maximum (L) is shown (dashed line) and used in D. Error bars, SE between biological repeats.

