Figure 1.
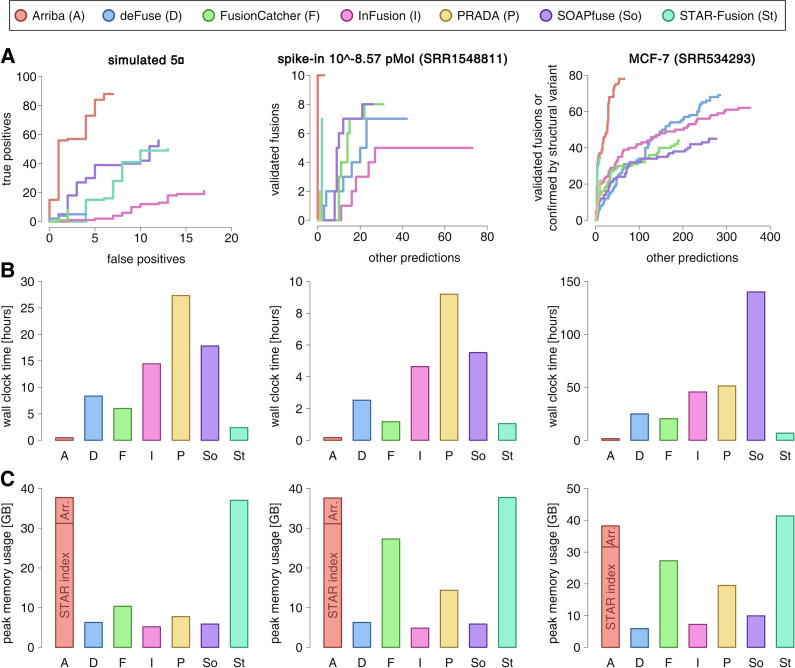
Benchmark of Arriba versus alternative methods. (A) Accuracy benchmarks. The figure shows samples from three types of benchmark data set: simulated fusions, spike-ins of synthetic fusions, and fusions described in the MCF-7 breast cancer cell line. The sensitivity/specificity trade-off is depicted using receiver operating characteristic (ROC)–like curves. The vertical axis indicates the number of true positives; the horizontal axis indicates the number of false positives (simulated data set) or nonvalidated predictions (spike-in and MCF-7 data sets). (B) Runtimes. (C) Peak memory consumption in gigabytes (GB). The aligner (STAR) and its index accounted for 31 GB of the memory footprint of Arriba's workflow. Approximately 7 GB were consumed by Arriba (Arr.) itself.

