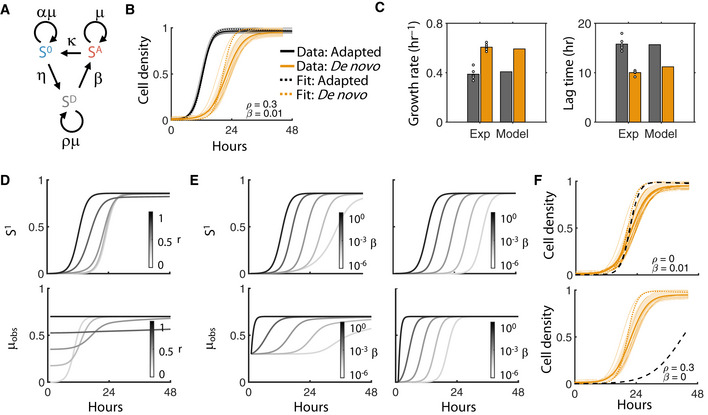
Figure 4. Conjugation model incorporating acquisition cost.

- Network diagram of conjugation model. The plasmid‐free population (S0) acquires the plasmid from the plasmid‐adapted population (SA), turning into a transient de novo transconjugant (SD) at a rate η (the conjugation efficiency). Finally, SA can revert to S0 according to the plasmid segregation error rate κ. The de novo population, in turn, transitions into the adapted population at the rate β. Growth rates for S0 and SD are scaled relative to the plasmid‐adapted population (µ) based on the scalars α and ρ, respectively. Not included in diagram: dilution of all populations out of the system at rate D.
- RP4 data were fit to the model to calculate β and ρ. Dotted line shows model fit. Data are from Fig 1C.
- Model predicts accurate growth rates and lag times based on fitted parameters.
- Parameter sensitivity to ρ. Bottom: Average observed growth rate is defined as (SDρµ+ SAµ)/(SD + SA), and is measured for increasing β from light to dark. Top: Corresponding population density of S1 over time. β is fixed to 0.01 based on RP4 fitting.
- Parameter sensitivity to β. Bottom: Average observed growth rate measured for increasing β from light to dark where ρ = 0.3 (left) or ρ = 0 (right). Top: Corresponding population density of S1 over time.
- RP4 data (Fig 4B) are re‐fit with fixed ρ (top) and fixed β (bottom).
