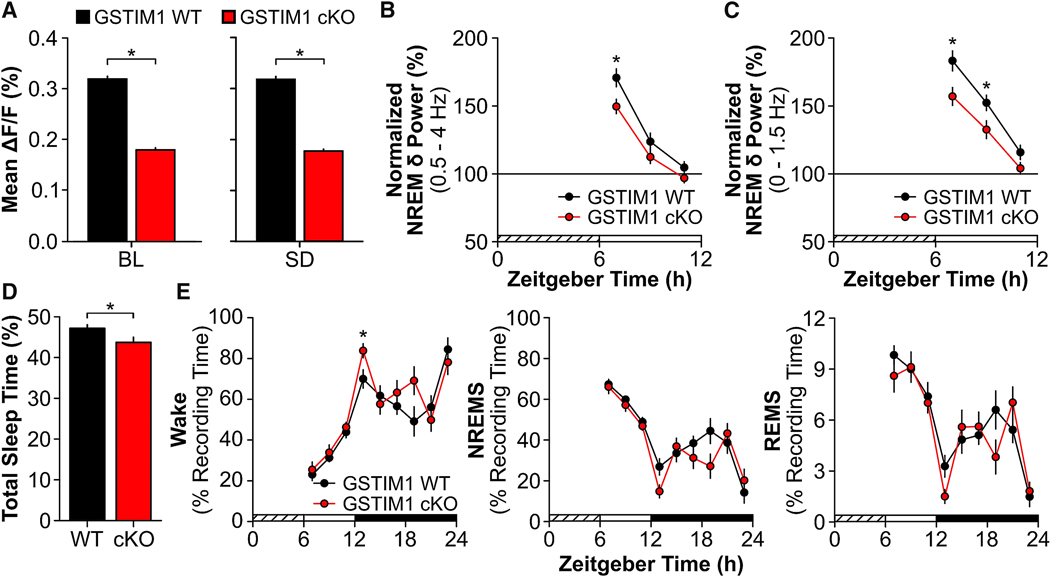
Figure 6. Reductions in Astroglial Ca2+ Attenuate Homeostatic Response to Sleep Deprivation.
(A) Mean ΔF/F values for GSTIM1 WT (black; n = 3) and GSTIM1 cKO (red; n = 4) at ZT6 under baseline (BL) and sleep deprived (SD) conditions (Mann-Whitney U). (B) Normalized NREM δ power (i.e. NREM SWA; 0.5 – 4 Hz) and (C) normalized low NREM δ power (0 – 1.5 Hz) during the first 6 h of recovery post-SD averaged across 2 h bins (repeated measures ANOVA). (D) Total time spent asleep (sum of NREMS and REMS) during the 18 h recovery phase post-SD expressed as percentage of total recording time for GSTIM1 WT (WT) and GSTIM1 cKO (cKO) (unpaired t-test). (E) Time spent in wake (left), NREMS (middle), and REMS (right) during the 18 h recovery phase post-SD expressed as a percentage of recording time across 2 h bins (repeated measures ANOVA). Values are means ± s.e.m. Group means for B – E are from n = 8 GSTIM1 WT and n = 9 GSTIM1 cKO mice. *, genotypic differences. p < 0.05. See also Figure S4, Figure S5, and Figure S6.

