Figure 1.
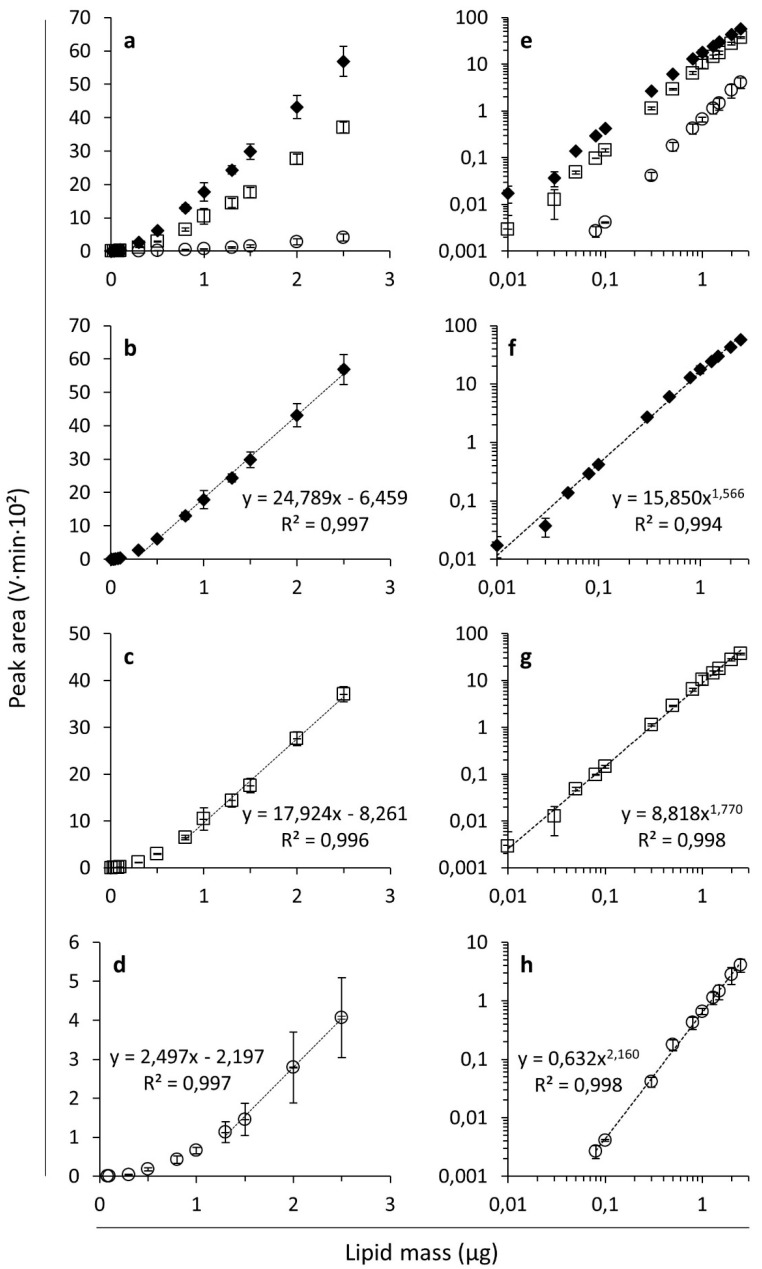
Evaporative light scattering detection responses expressed as peak areas (V·min·102) as a function of the analyzed lipid mass (µg) for free fatty acids (FFAs ◆; linoleic acid), monoacylglycerols (MAGs ○; monoolein) and diacylglycerols (DAGs □; 1,3-dilinolein) on linear (a–d) and logarithmic (e–h) scales. Average values with corresponding standard deviations of triplicate measurements are shown. Linear trend lines were fitted to the data in the range of linear response for FFAs (b), DAGs (c) and MAGs (d). Power trend lines were fitted to the data for FFAs (f), DAGs (g) and MAGs (h). The graphs show the corresponding trend line equations and R-squared values.

