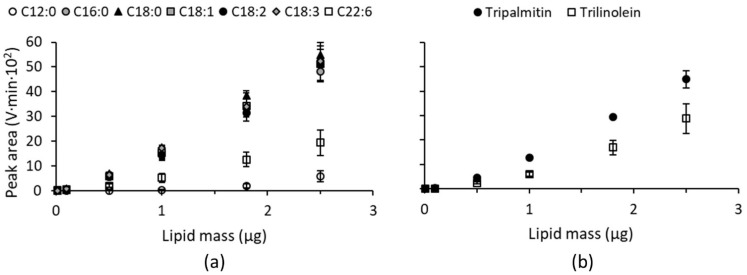
Figure 2.
Evaporative light scattering detection responses expressed as peak areas (V·min·10²) as a function of the analyzed lipid mass (µg) for different (a) free fatty acids and (b) triacylglycerols. Average values with corresponding standard deviations of triplicate measurements are shown. C12:0, lauric acid; C16:0, palmitic acid; C18:0, stearic acid; C18:1, oleic acid; C18:2, linoleic acid; C18:3, linolenic acid; C22:6, cervonic acid.

