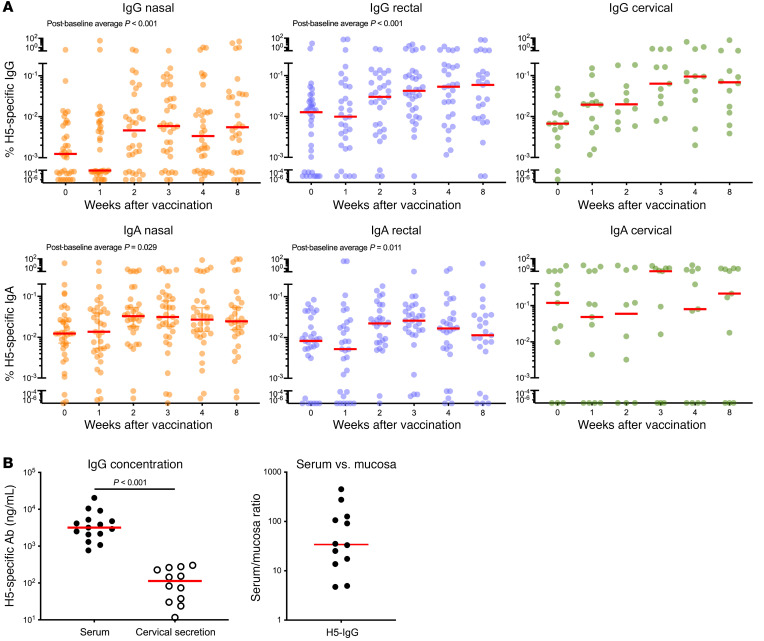
Figure 4. Induction of H5-specific antibodies at mucosal sites.
(A) The proportions of H5 HA-specific IgG (n = 14–37) and IgA (n = 13–37) in nasal (orange), rectal (blue), and cervical (green) secretions were calculated against total IgG and IgA. All available samples from intranasal and tonsillar groups were assessed. Participants who were seropositive for Ad4 at baseline were excluded. Red horizontal bars indicate median values. Generalized estimating equations with an autoregressive correlation structure were used to calculate P values (week 0 measurements were not included), and only significant P values are shown. (B) Shown are serum (n = 15) and cervical secretion (n = 12) concentrations of H5-specific IgG 4 weeks after vaccination and the ratio of H5-specific antibodies in serum versus cervical secretions (n = 12). A paired t test was used to calculate P values. Red horizontal bars indicate median values.

