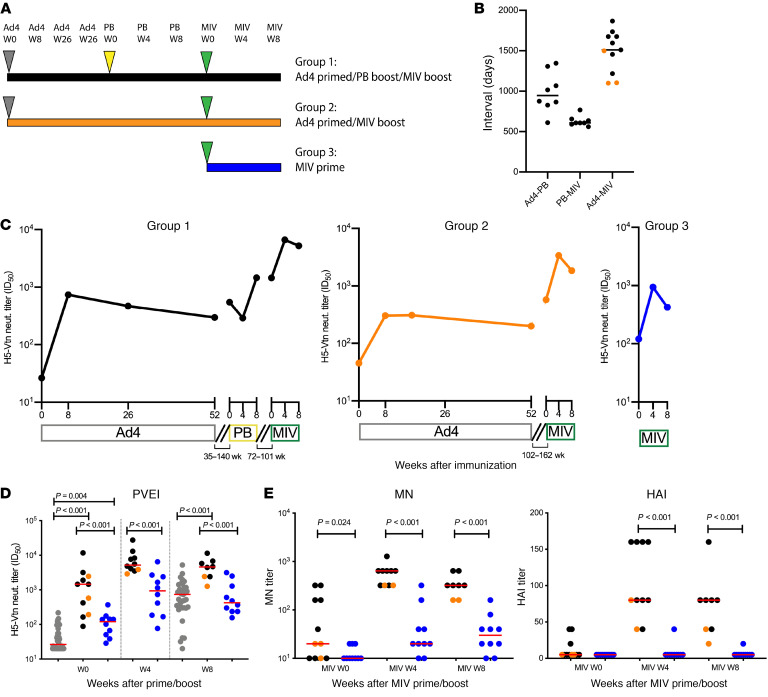
Figure 5. Neutralization antibody titers after a MIV prime/boost.
(A) Immunization schedule. Ad4 (gray triangles), PanBlok (PB) (yellow triangle), and MIV (green triangles) immunizations are shown. (B) Interval between each immunization. Black circles indicate the participants in group 1, and orange circles indicate the participants in group 2 (n = 3). Participants with less than a 4-fold increase in Ad4 neutralization titers after immunization were excluded. (C) Longitudinal changes in the median H5 HA-specific neutralization antibody titers, shown as the median ID50 in serum from participants in group 1 (n = 8), group 2 (n = 3), and group 3 (n = 10), were measured by the PVEI assay. The same exclusion criteria as in B were applied. The intervals between each immunization are shown as disconnected lines between time points. (D) Post-vaccination MIV prime/boost H5 HA-specific neutralizing antibody titers in serum from participants group 1 (black, n = 8) group 2 (orange, n = 3), and group 3 (blue, n = 10) were measured by the PVEI assay. The time points for before and 8 weeks after Ad4 priming (intranasal and tonsillar groups combined are shown in gray; n = 36) are also included for comparison. The same exclusion criteria as in B were applied. Two-sample t tests were used to calculate P values. Red horizontal bars indicate median values. (E) Post-vaccination MIV prime/boost H5 HA-specific neutralizing antibody titers in serum were measured by MN and HAI assays (group 1, n = 8; group 2, n = 3; group 3, n = 10). The same exclusion criteria as in B were applied. Red horizontal bars indicate median values. Two-sample t tests were used to calculate P values. Only significant P values are shown. In multiple-comparison calculations including all P values, the FDR was estimated to be 3% using the Benjamini-Hochberg procedure, and a fixed P value significance threshold was set at 0.05.

