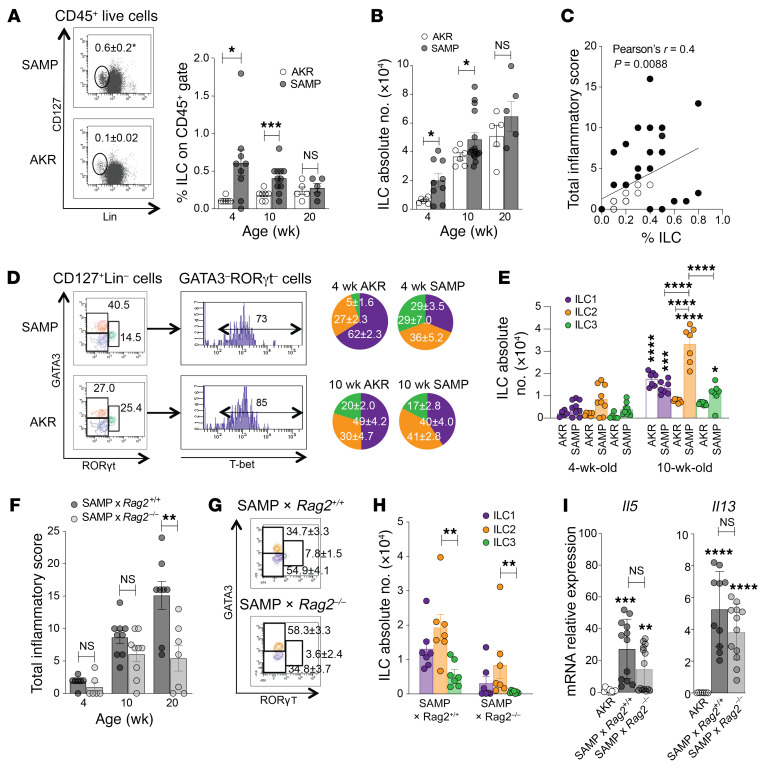
Figure 1. Increased ILC2s during early disease in ileitis-prone SAMP mice that persists in the absence of adaptive immunity.
(A) Gating strategy to detect total ILCs, identified as CD127+ and lineage– (Lin–) cells within the live CD45+ population (4-week-old mice, left) in draining MLNs of SAMP vs. AKR (control) mice, expressed as percentages (right) and (B) absolute numbers (n = 5–11). *P ≤ 0.05, ***P ≤ 0.001 by 2-tailed, unpaired Student’s t test. (C) Correlation by Pearson’s r between ILC frequency and disease severity ian SAMP and AKR mice (purple; n = 28). (D) ILC subsets, defined by GATA3+ (ILC2, orange), RORγt+ (ILC3, green), and GATA3–RORγt–T-bet+ (ILC1, purple) within the CD45+CD127+Lin– population (representative plots from 10-week-old mice, left), expressed as percentages (right) and (E) absolute numbers (n = 7–9). *P ≤ 0.05, ***P ≤ 0.001, ****P ≤ 0.0001 vs. 4-week-old mice or as indicated by the horizontal bars, by 2-way ANOVA with Tukey’s multiple-comparison post hoc test. (F) Ileitis severity in SAMP × Rag2–/– vs. WT (SAMP × Rag2+/+) mice (n = 7–10), with ILC (G) percentages (10-week-old mice shown) and (H) absolute numbers (n = 7). (I) Th2 cytokine expression, shown as fold-difference vs. AKR, which was set arbitrarily as 1 (n = 7–14). **P ≤ 0.01, ***P ≤ 0.001, ****P ≤ 0.0001 by 2-tailed, unpaired Student’s t test. Experiments were performed at least in duplicate.

