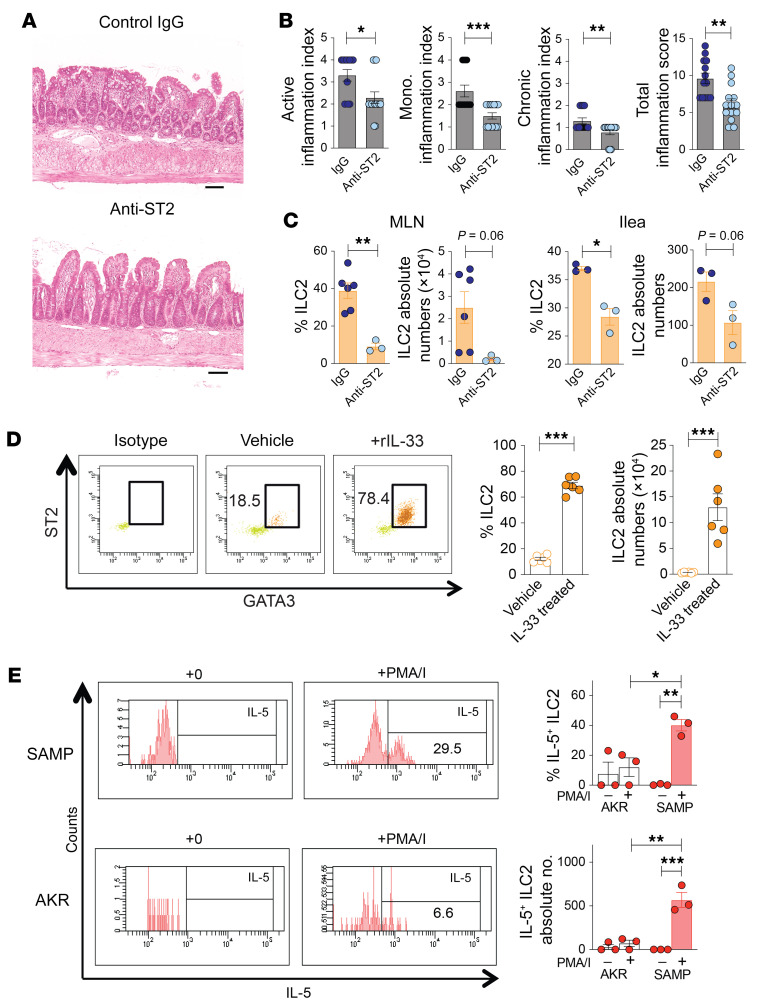
Figure 2. Blockade of IL-33 signaling reduces ILC2 expansion and function, and protects from ileitis.
(A) Representative H&E-stained histologic images (scale bars: 100 μm), (B) disease severity, and (C) ILC2s in SAMP mice after anti-ST2 vs. control IgG (n = 13–14). (D) Representative dot plots (left) and frequency/absolute numbers (right) of MLN-derived ST2+GATA3+ ILC2s in healthy AKR mice after exogenous rIL-33 vs. vehicle (n = 6). (E) Representative histograms (left) and IL-5–expressing ILC2s (right) after ex vivo stimulation with and without PMA/ionomycin (I) in the presence of brefeldin A (n = 3). *P ≤ 0.05, **P ≤ 0.01, ***P ≤ 0.001 by 2-tailed, unpaired Student’s t test (B–D) or 2-way ANOVA with Tukey’s multiple-comparison post hoc test (E). Experiments were performed in triplicate.

