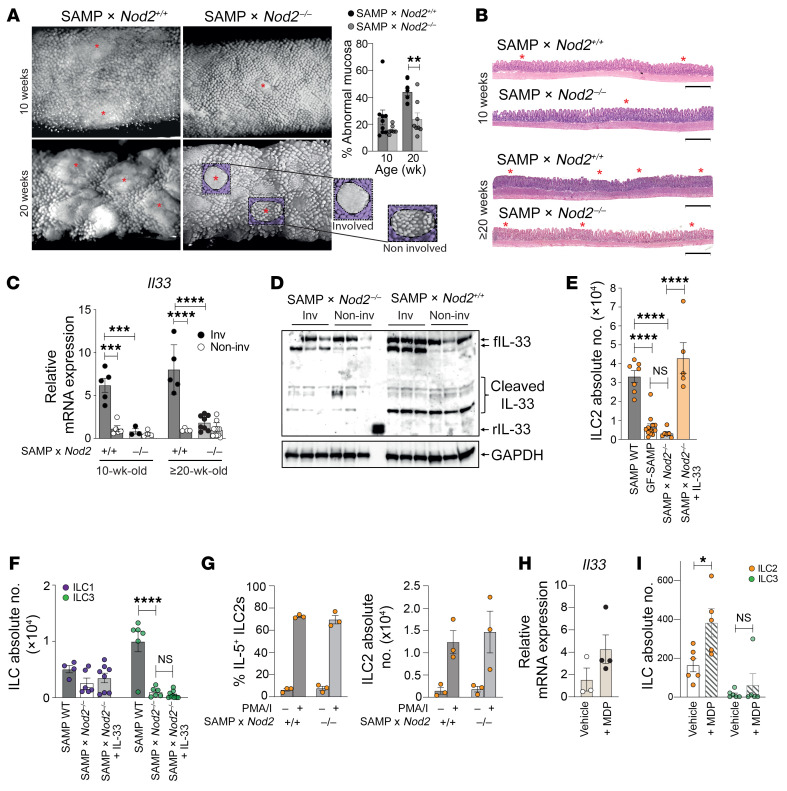
Figure 3. Nod2 regulates IL-33–mediated ILC2 expansion and function during SAMP ileitis.
(A) Representative 3D stereomicroscopy (SM) images of SAMP × Nod2–/– and WT (SAMP × Nod2+/+) ilea, highlighting cobblestone lesions (red asterisks), with SM scores and (B) representative H&E-stained histologic images (n = 7–9). Scale bars: 500 μm. (C) Relative Il33 expression, with noninvolved WT set arbitrarily as 1 (n = 4–11), and (D) representative Western blots showing bioactive, full-length (f), and cleaved IL-33 in 10-week-old SAMP × Nod2–/– vs. WT ilea (n = 3). (E and F) ILCs in 10-week-old WT, GF-SAMP (E only), and SAMP × Nod2–/– with and without rIL-33 (n = 6–12). (G) IL-5–expressing ILC2s after ex vivo activation with and without PMA/ionomycin (I) in the presence of brefeldin A (n = 3). (H) Relative Il33 expression, with vehicle-treated set arbitrarily as 1, and (I) ileal ILC2s/ILC3s in MDP- vs. vehicle-treated GF-SAMP mice (n = 5–6). *P ≤ 0.05, **P ≤ 0.01, ***P ≤ 0.001, ****P ≤ 0.0001 by 2-tailed, unpaired Student’s t test (A and G–I), and 1-way (E and F) or 2-way ANOVA (C) with Tukey’s multiple-comparison post hoc test. Experiments were performed at least in duplicate.

