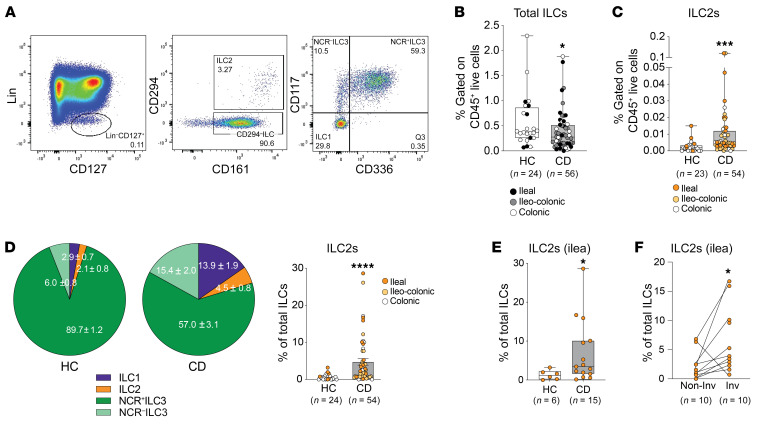
Figure 4. Increased ILC2s in CD patients versus healthy controls.
(A) Gating strategy to detect total ILCs (Lin–CD161+CD127+ in live CD45+ population), ILC2s (CD294+), NCR+ ILC3s (CD294–CD117+CD336+), NCR– ILC3s (CD294–CD117+CD336–), and ILC1s (CD294–CD117–CD336–) in gut mucosal biopsies from CD (shown) vs. healthy controls (HC), with frequencies of (B) total ILCs and (C) ILC2s by disease location, displayed as box plots (25th, 50th, and 75th quantiles shown). (D) Percentages of ILC subsets in total ILC population, highlighting differences in ILC2s between CD vs. HC, and ILC2s in ileum-specific CD, compared with (E) HC and (F) in noninvolved vs. involved lesions from individual CD patients. *P ≤ 0.05, ***P ≤ 0.001, ****P ≤ 0.0001 by 2-tailed unpaired Mann-Whitney test (B–E) or 2-tailed paired t test (F).

