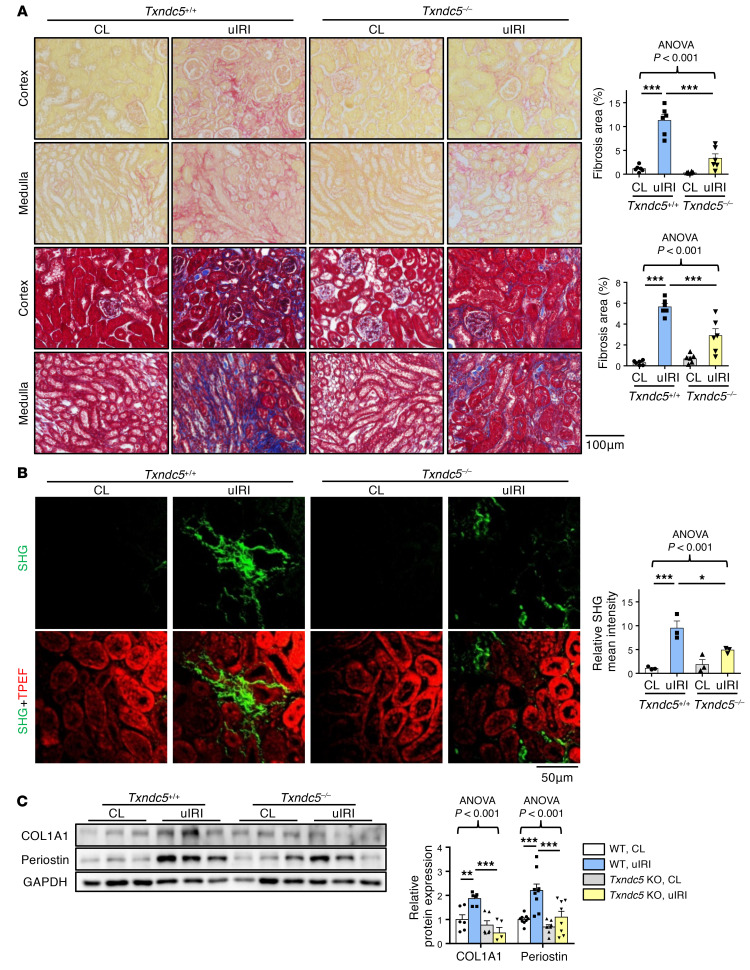
Figure 5. Deletion of Txndc5 ameliorated renal fibrosis induced by uIRI.
(A) Picrosirius red staining (top 2 panels) and Masson’s trichrome staining (bottom 2 panels) of kidney sections from WT and Txndc5–/– mice 28 days after uIRI. Bar graphs of the quantitative results of Picrosirius red and Masson’s trichrome staining areas are shown on the right (n = 6). Scale bar: 100 μm. (B) SHG images of the kidney sections from WT and Txndc5–/– mice 28 days after uIRI. The quantitative results of SHG-positive areas showed increased accumulation of fibrillar collagen (green) in WT but not in Txndc5–/– mice kidneys following injury. For each of the kidney sections imaged for SHG, TPEF imaging was obtained to show the profile of the scanned tissue (red color in bottom panels) (n = 3). Scale bar: 50 μm. (C) Immunoblots showed protein expression levels of fibroblast activation marker (Periostin) and ECM (COL1A1) in the whole-kidney extract from WT and Txndc5–/– mice 28 days after uIRI (n = 5–9). Data are representative of 3 or more independent experimental replicates. For all panels, data are presented as mean ± SEM. The statistical significance of differences among 3 or more groups was determined using 1-way ANOVA, followed by Sidak’s post hoc tests. *P < 0.05, **P < 0.01, ***P < 0.001.

