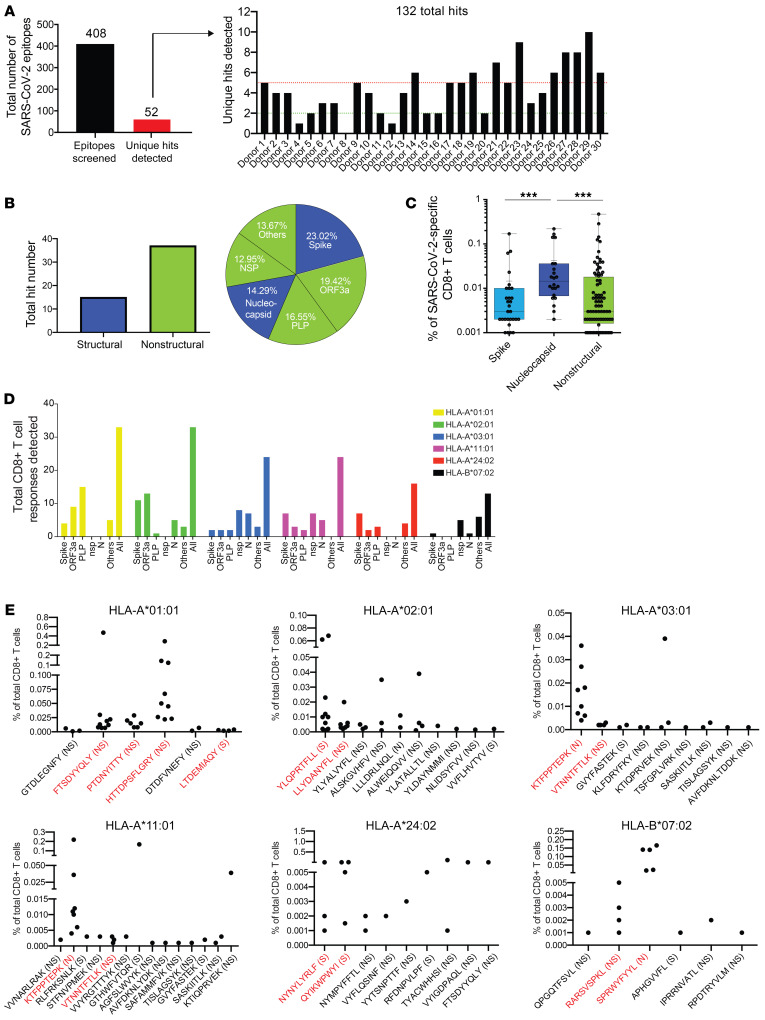
Figure 2. Breadth and magnitude of SARS-CoV-2–specific CD8+ T cells.
(A) Bar plots summarizing the absolute numbers of SARS-CoV-2 antigen specificities detected across donors within cross-sectional sample. Out of 408 SARS-CoV-2 peptide candidates, 52 unique peptide hits were detected. Between 0 and 13 unique hits were detected in each donor sample (5 or more hits in > 40% of all donors). In total, 132 SARS-CoV-2–specific T cell hits were detected. (B) Delineation of T cell reactivities against the SARS-CoV-2 proteome. The majority of epitope hits detected derived from nonstructural SARS-CoV-2 proteins. Pie chart displaying the percentages of epitopes detected derived from structural (nucleocapsid, spike) and nonstructural (NSP, PLP, ORF3a, others) proteins spanning the full proteome of SARS-CoV-2. (C) Frequencies of SARS-CoV-2–specific T cells reactive with epitopes derived from spike, nucleocapsid, and nonstructural proteins. Highest frequencies were detected for T cells targeting peptides from the nucleocapsid protein. Each dot represents 1 hit. ***P < 0.001. Kruskal-Wallis test. P values were adjusted for multiple testing using the Benjamini-Hochberg method to control the false discovery rate. (D) Numbers of epitope-specific T cell responses from the different protein categories detected across all 6 HLA alleles tested. (E) Definition of high- and low-prevalence hits per HLA allele. Plots showing individual peptide hits for each allele. Each dot represents 1 hit. High-prevalence epitope hits are indicated in red and were defined as events detected in at least 3 donor samples or in more than 35% of donors for each allele group. NS, nonstructural; N, nucleocapsid; S, spike.

