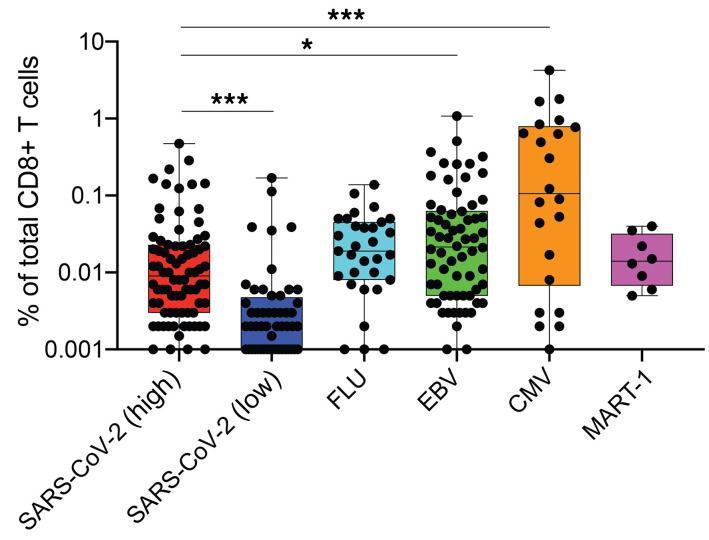
Figure 3. Comparison of frequencies of SARS-CoV-2–specific T cell and T cells reactive with influenza, EBV, CMV, or endogenous MART-1 epitopes.
The percentage of SARS-CoV-2–specific T cells was higher for epitopes categorized as high-prevalence hits but lower than the frequencies of T cells reactive with EBV or CMV antigens detected. *P < 0.05, ***P < 0.001. Kruskal-Wallis test. P values were adjusted for multiple testing using the Benjamini-Hochberg method to control the false discovery rate.

