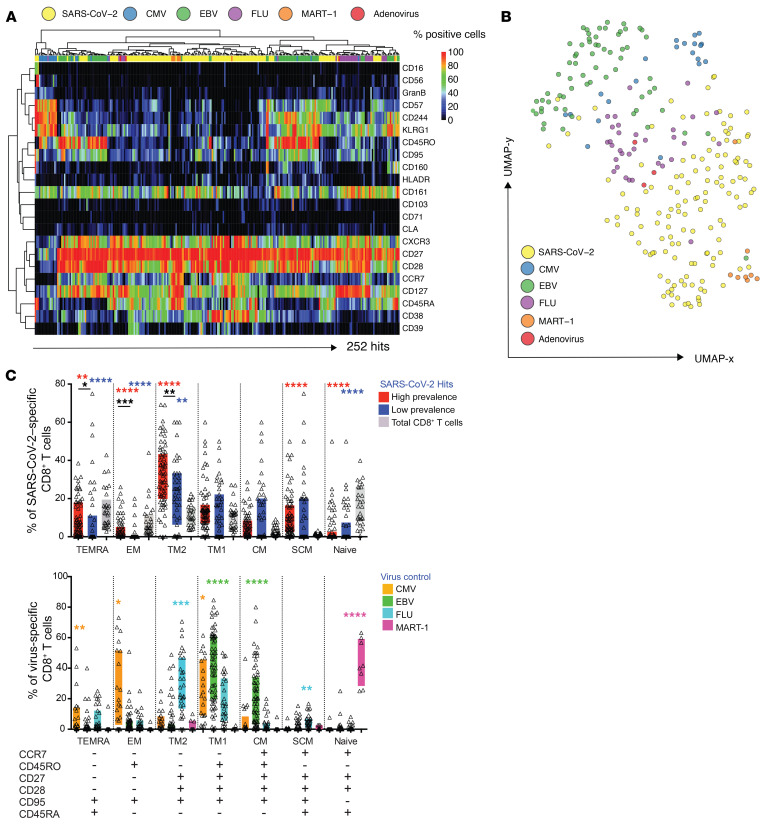
Figure 4. SARS-CoV-2–specific CD8+ T cells display a unique phenotype and can be categorized into different subsets.
(A) Heatmap summarizing the expression frequencies of all phenotypic markers analyzed among the total pool of SARS-CoV-2–specific and unrelated control antigen–specific CD8+ T cells detected in the same cross-sectional sample. The majority of SARS-CoV-2–specific T cells cluster differently from common virus-specific T cells. Antigen specificities and phenotypic markers were clustered using Pearson correlation coefficients as distance measure. (B) UMAP plot showing the clustering of all antigen-specific T cells by antigen category. SARS-CoV-2–specific CD8+ T cells occupy the lower region of the 2D map. Clustering is based on the expression of all phenotypic markers assessed. Each dot represents 1 hit. (C) Differentiation profiles of SARS-CoV-2–specific CD8+ T cells and common virus control antigen–specific T cells. Based on the expression of the markers below the bar diagrams, antigen-specific and total CD8+ T cells were categorized into distinct states of differentiation. SARS-CoV-2–specific T cells were enriched in SCM and TM2 cells. Control virus hits could be separated into distinct subsets dependent on the target epitope. *P < 0.1, **P < 0.01, ***P < 0.001, ****P < 0.0001. Wilcoxon rank sum test. SCM, stem cell memory cells; TM, transitional memory cells; TEMRA, terminal effector memory cells reexpressing CD45RA; EM, effector memory cells; CM, central memory cells.

