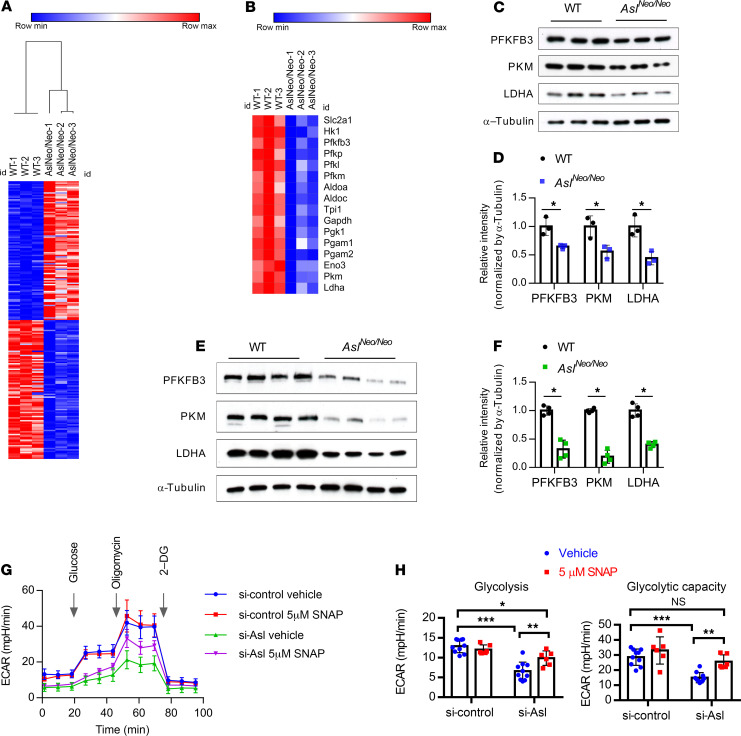
Figure 2. Deletion of Asl in osteoblast lineage cells leads to downregulation of glycolysis pathway.
(A) Heatmap of the top 200 differentially expressed transcripts (100 upregulated and 100 downregulated) detected using RNA-seq in BMSC-derived osteoblasts from WT and AslNeo/Neo mice. BMSCs were cultured in osteogenic medium for 14 days. n = 3. (B) Heatmap of downregulated glycolysis pathway–related genes in BMSC-derived osteoblasts from WT and AslNeo/Neo mice. (C) Protein levels of PFKFB3, PKM, and LDHA by Western blot and (D) quantification of Western blot from WT and AslNeo/Neo BMSC–derived osteoblasts. n = 3. (E) Protein levels of PFKFB3, PKM, and LDHA by Western blot and (F) quantification of Western blot from WT and AslNeo/Neo mouse long-bone protein extracts. n = 4. (G and H) Seahorse assay of glycolytic activity (ECAR) in Asl-knockdown ST2 cells (siRNA mediated) with 5 μM NO donor S-nitroso-N-acetylpenicillamine (SNAP) or 5 μM DMSO (vehicle) 18-hour treatment (n = 6–10; data are representative of 3 independent experiments). 2-DG, 2-deoxyglucose. Data are presented as mean ± SD. Student’s t test (D and F) and 2-way ANOVA followed by Tukey’s multiple-comparison test (H). *P < 0.05; **P < 0.01; ***P < 0.005. NS, not significant (P > 0.05).

