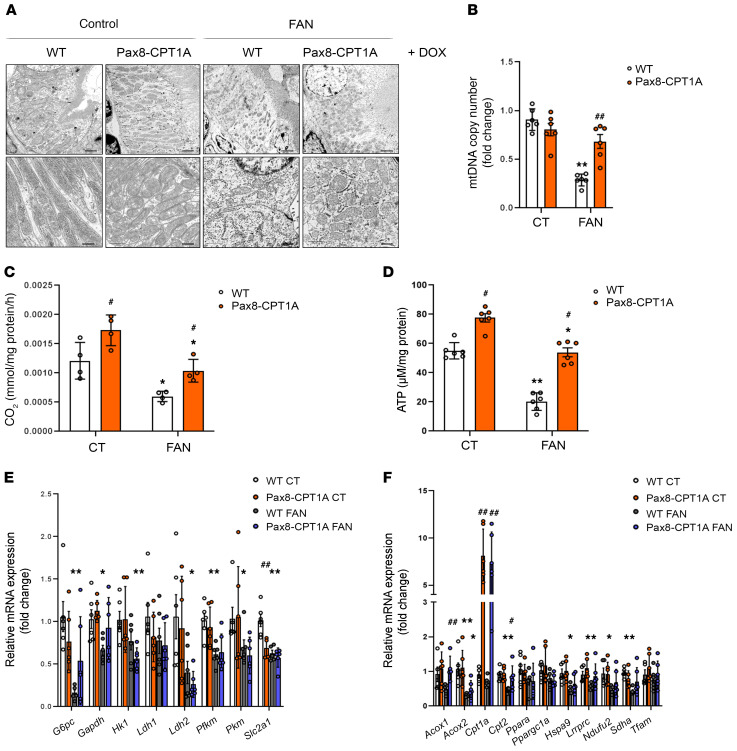
Figure 3. CPT1A prevents impaired mitochondrial morphology and FAO defect in FAN-induced kidney fibrosis.
(A) Representative electron microscopy images of cortical proximal tubules from control and Pax8-CPT1A mice subjected to FAN after doxycycline induction. Scale bars: 10 μm (upper panels), 100 nm (lower panels). (B) Mitochondrial DNA copy number (mtDNA) was determined in kidneys of WT and Pax8-CPT1A mice in the FAN model. Bar graphs represent the mean ± SEM of fold changes (n = 6 mice). **P < 0.01 compared with their corresponding control (CT) kidneys; ##P < 0.05 compared with kidneys from WT mice with the same experimental condition. (C) Radiolabeled palmitate-derived CO2 was determined after incubation of 14C-palmitate with kidney tissue from WT and Pax8-CPT1A mice in the FAN model after doxycycline induction. (D) ATP levels in total kidney tissue determined in mice subjected to FAN model. (C and D) Bar graphs represent the mean ± SEM (n = 4 mice). *P < 0.05, **P < 0.01 compared with their corresponding CT kidneys; #P < 0.05 compared with kidneys from WT mice with the same experimental condition. (E and F) mRNA levels of glucose utilization–associated genes (E) and peroxisomal/mitochondrial function–associated genes (F) were determined by qRT-PCR using TaqMan qPCR probes in kidneys from CT and FA-treated (FAN) WT and Pax8-CPT1A mice after doxycycline induction. (E and F) Bar graphs represent the mean ± SEM of fold changes (n = 6 mice). *P < 0.05, **P < 0.01 compared with their corresponding CT kidneys; #P < 0.05, ##P < 0.01 compared with kidneys from WT mice with the same experimental condition. Statistical significance between 2 independent groups was determined using nonparametric 2-tailed Kruskal-Wallis test. For detailed gene nomenclature, see Supplemental Table 4.

