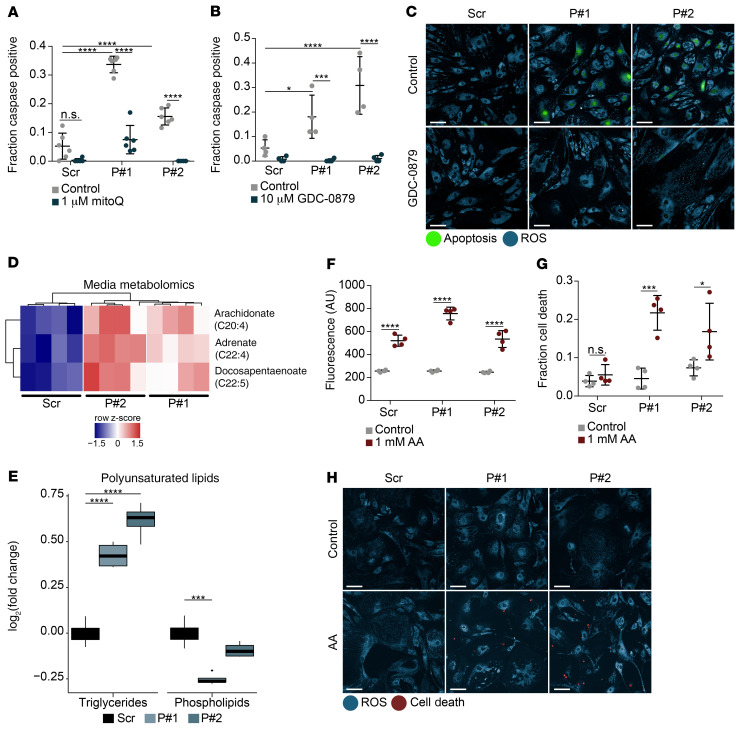
Figure 3. Metabolomics reveal altered lipid/PUFA profiles in CoQ-deficient Pdss2-depleted podocytes.
(A) Caspase-positive quantification of podocytes expressing either scrambled or Pdss2-targeted shRNAs (P#1, P#2) and rescue of apoptosis with mitoQ. n = 6. (B) Apoptosis quantification after 1-week GDC-0879 treatment of Pdss2-depleted podocytes and scrambled controls. n = 4. (C) Live-cell fluorescence imaging of cellular ROS (blue) and apoptosis (green) in cells treated with GDC-0879 (10 μM). Scale bars: 100 μm. (D) Heatmap of statistically significant metabolites (FDR < 10%, Benjamini-Hochberg correction on Student’s t test) from conditioned media of Pdss2-depleted podocytes versus scrambled controls. n = 4. (E) Log2 fold change of polyunsaturated TAGs and polyunsaturated PLs in Pdss2-depleted podocytes versus scrambled controls. n = 4. Polyunsaturated lipids limited to lipids with 4–8 double bonds. (F) Cellular ROS quantification after AA treatment for 12 hours. n = 4. (G) Cell viability quantification after AA treatment for 84 hours, n = 4. (H) Live cell fluorescence imaging of cellular ROS (blue) and cell death (red) in cells treated with AA (1 mM) for 84 hours. Scale bars: 100 μm. Two-way ANOVA, Tukey’s multiple comparison test, unless otherwise noted. *P < 0.05; ***P < 0.001; ****P < 0.0001.

