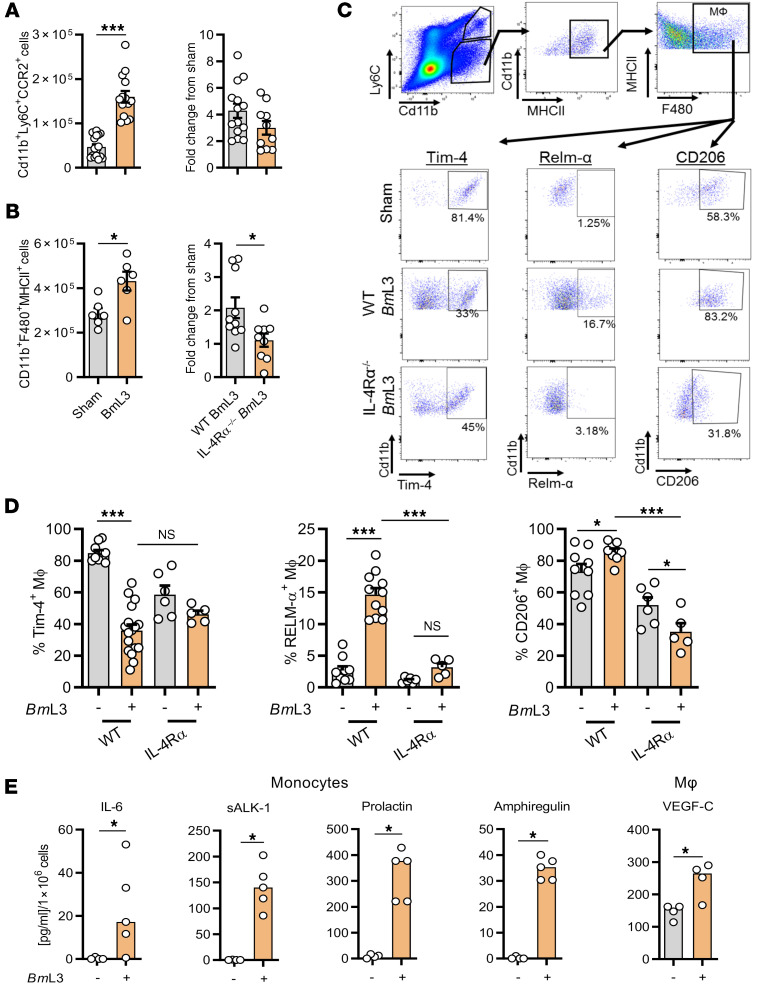
Figure 5. BmL3 infection drives lymphatic monocyte recruitment and expansion of alternatively activated, prolymphangiogenic macrophages.
(A) Numbers of CD11b+Ly6C+CCR2+ inflammatory monocytes (n = 16 sham, n = 14 WT BmL3, n = 10 IL-4Rα–/– BmL3) or (B) Cd11b+F4/80+MHCII+ MΦs (n = 6 sham, n = 10 WT BmL3; n = 9 IL-4Rα–/– BmL3) derived from sdLNs and major lymphatic channels in C57BL/6J mice, 14 dpi. Data are total cell numbers or fold-change from relevant sham controls. (C) Representative flow plots of lymphatic MФ phenotyping in sham- and BmL3-infected mice. Percentages are proportions of total CD11b+F4/80+MHCII+ MΦs. (D) CD206+, RELM-α+, and Tim-4+ MΦ expression in WT and IL-4Rα–/– sham- and BmL3-infected mice (n = 9 WT sham, n = 9–17 WT BmL3, n = 6 IL-4Rα–/– sham, n = 5 IL-4Rα–/– BmL3). (E) Significant changes in specific lymphangiogenic molecules secreted following 72-hour ex vivo incubation of FACS-isolated lymphatic monocytes or MΦs derived from sham- or BmL3-infected mice. Secretion is normalized to analyte concentration/1 × 106 cells (n = 4 sham, n = 5 BmL3). Data were pooled from 2–3 individual experiments. Histograms show the mean ± SEM (A–D) or median (E). *P < 0.05, ***P < 0.001 by 2-tailed Student’s t test (A and B), 1-way ANOVA with Tukey’s multiple-comparison post hoc test (D), or Mann-Whitney test (E). NS, not significant.

