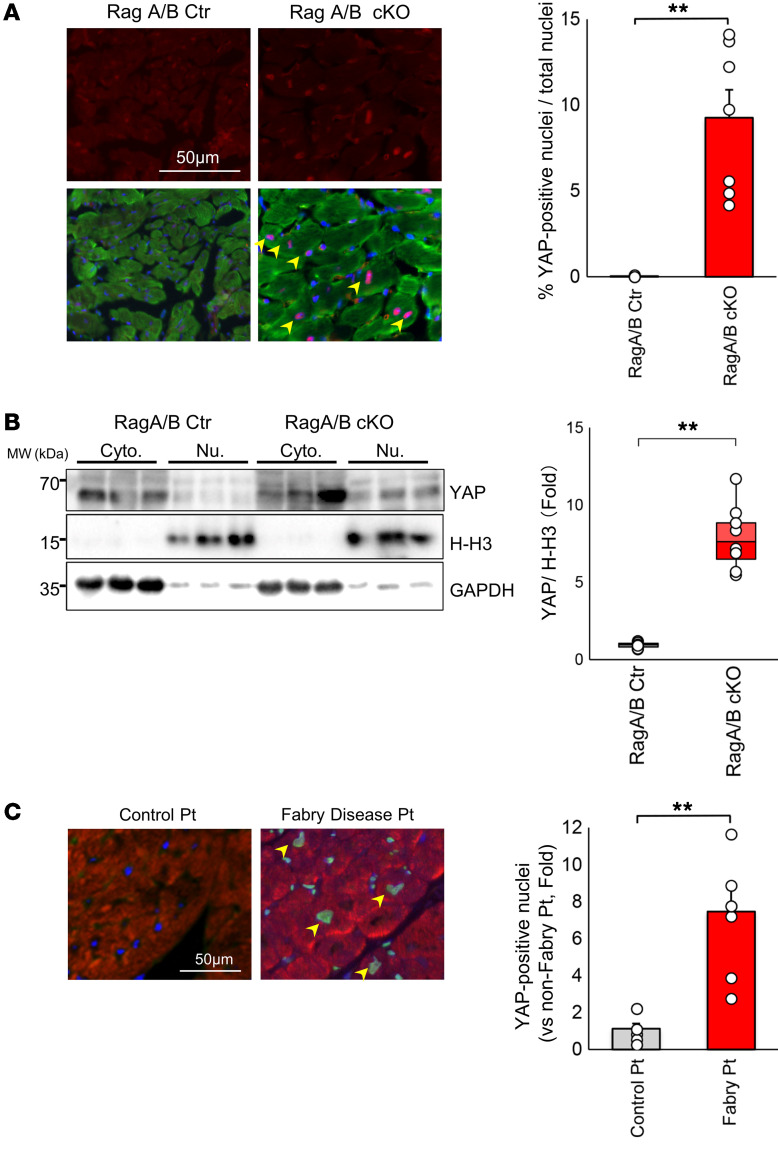
Figure 2. Nuclear accumulation of YAP in RagA/B cKO mouse hearts.
(A) Representative micrographs and quantitative analysis of nuclear YAP (red, YAP; green, sarcomeric actin; blue, DAPI). Symbols indicate mean percentage of YAP-positive nuclei/total nuclei calculated from more than 20 power fields per experiment. Arrowheads indicate YAP-positive nuclei in cardiomyocytes. n = 7. (B) Representative images of YAP immunoblots of cytosolic and nuclear fractions. n = 8. For A and B, analyses were carried out at 12 weeks of age. (C) Representative micrographs and quantitative analysis of nuclear YAP in the heart. Heart specimens obtained from control patients without Fabry disease (n = 8) and from Fabry disease patients (n = 7) were subjected to immunostaining with anti-YAP and anti-sarcomeric actin antibodies. Quantitative analysis is shown on the right. Symbols indicate relative mean YAP-positive nuclei/total nuclei calculated from more than 10 high-power fields per experiment. The mean YAP-positive nuclei/total nuclei in control patient hearts was define as 1. Results are expressed as mean ± SEM in A and C. In B, results are shown as box plots, showing the median (center line) and IQR. Whiskers represent minima and maxima within 1.5 IQR as indicated. **P < 0.01, ANOVA.

