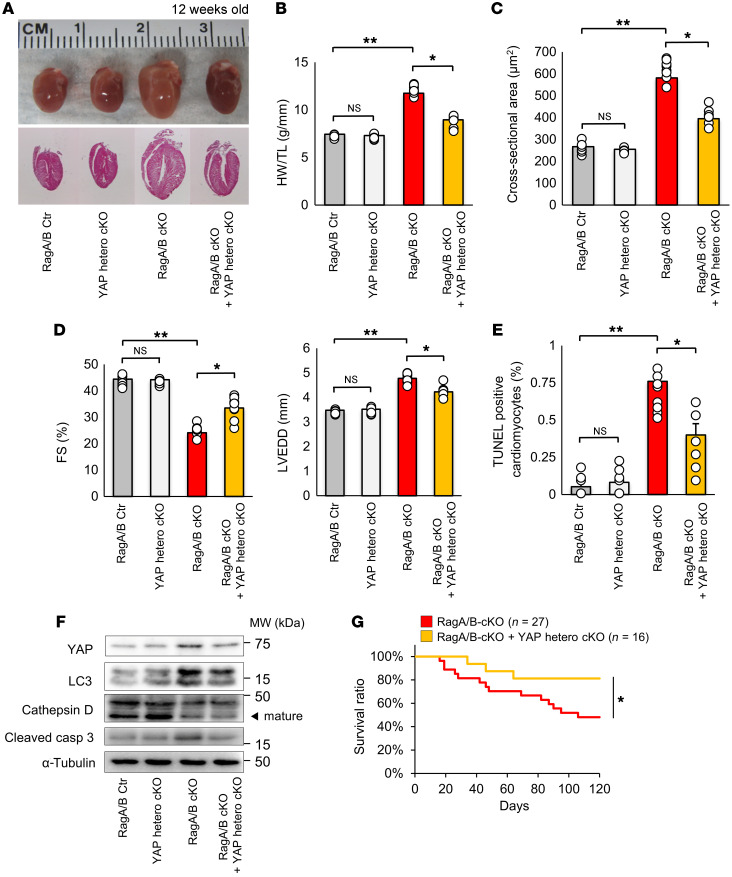
Figure 3. Heterozygous deletion of YAP in RagA/B cKO mice reduces cardiac hypertrophy and alleviates cardiac dysfunction.
(A) Representative whole-mount images and sagittal sections of control, YAP hcKO, RagA/B cKO, and RagA/B-cKO+YAP hcKO mouse hearts at 12 weeks old. (B) Quantitative analysis of HW/TL at 12 weeks. n = 8. (C) Quantitative analysis of CM CSA. n = 8. (D) Quantitative analysis of FS and LVEDD, as evaluated with echocardiographic measurements. n = 8. (E) Quantitative analysis of TUNEL-positive CMs. n = 8. Symbols indicate percentage of TUNEL-positive cardiomyocytes calculated from more than 10 high-power fields per experiment. (F) Representative immunoblots of heart homogenates. Blots run in parallel, contemporaneously, using identical samples are shown. n = 8. Analyses were carried out at 12 weeks of age in A–F. (G) Kaplan-Meier survival curves. Results are expressed as mean ± SEM. *P < 0.05; **P < 0.01, ANOVA.

