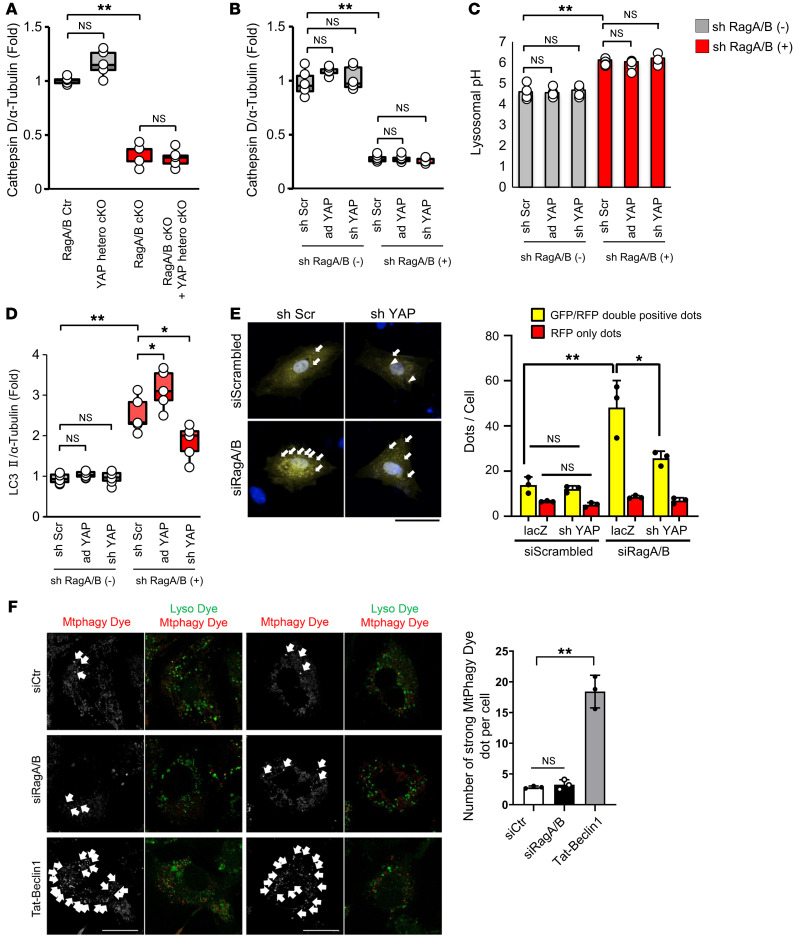
Figure 4. Downregulation of YAP attenuates autophagy without affecting lysosomal function in the presence of RagA/B downregulation.
(A) Quantitative analysis of immunoblotting for cathepsin D/α-tubulin in mouse hearts. n = 6. (B) Quantitative analysis of immunoblotting for cathepsin D/α-tubulin in cultured CMs. n = 5. (C) Quantitative analysis of lysosomal pH in cultured CMs. Relative intensity was obtained from more than 10 cells per each experiment. n = 4. (D) Quantitative analysis of immunoblotting for LC3II/α-tubulin in cultured CMs. n = 5. (E) Representative images of mRFP-GFP-LC3 puncta in cultured CMs in vitro. Quantitative analyses of LC3 puncta are shown on the right. Yellow puncta (left, indicated by arrows) and columns (right) indicate GFP-RFP double-positive puncta and represent autophagosomes, whereas red puncta (left, indicated by arrowheads) and columns (right) indicate GFP negative-RFP positive puncta and represent autolysosomes. Puncta were measured from more than 100 cells per experiment. n = 3. (F) Neonatal CMs were treated with siControl or siRagA/B for 60 hours or 5 μM TAT–beclin 1 for 24 hours. Cells were treated with 100 nM MtPhagy Dye and 1 μM Lyso dye. Strong MtPhagy Dye puncta colocalized with Lysodye (indicated by white arrows) were counted from more than 20 cells per experiment. n = 3. Scale bars: 20 μm. In A, B, and D, results are shown as box plots, showing the median (center line) and IQR. Whiskers represent minima and maxima within 1.5 IQR as indicated. In C, results are expressed as mean ± SEM. In E and F, results are expressed as mean ± SD. *P < 0.05; **P < 0.01, ANOVA.

