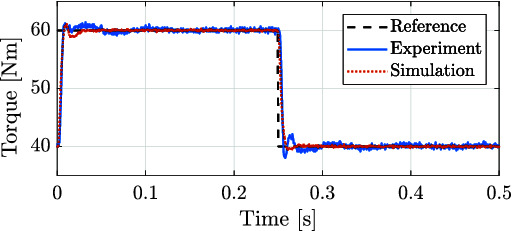
Figure 13.

Torque applied for both the experimental (solid blue line) and simulated (red dashed line) corresponding to the tracking of a step signal with blocked joint load. The time response for 10% of the maximum output torque suggests a torque control bandwidth between 50 Hz and 100 Hz during blocked condition.
