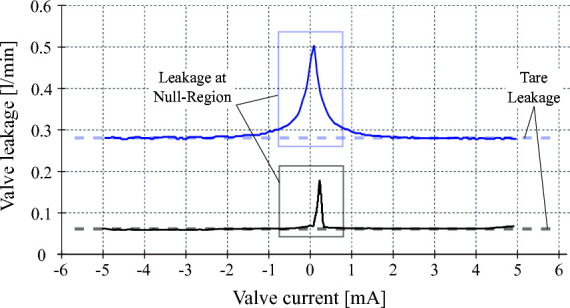
Figure 6.

Valve tare and null-region leakages for the high response valve (blue curve) and for the ultra-low leakage valve (black curve). Experimental measurements show about 0.06 l/min and 0.28 l/min of tare leakage for the ULLV and HRV valves, respectively. Leakage peaks at spool null region are about 0.5 l/min for the HRV and 0.17 l/min for the ULLV. Considering an operating pressure supply of 20.7 MPa, the ULLV may save about to 41 W due to tare leakage and up to 112 W at the spool null region.
