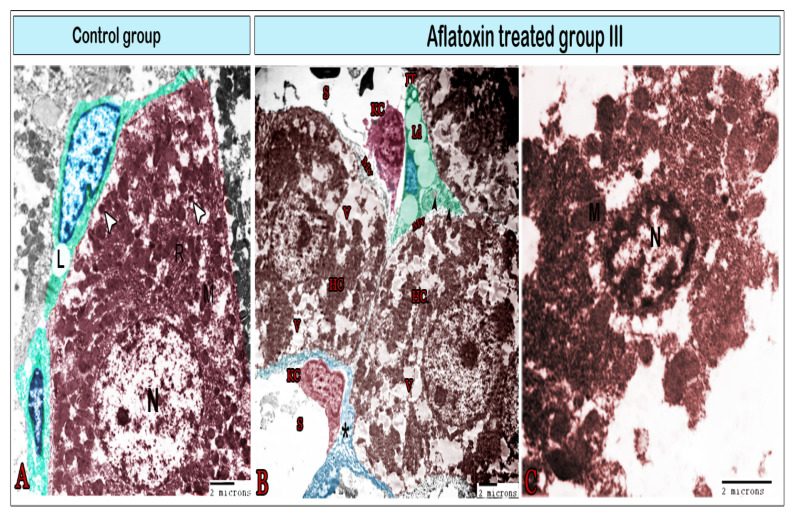
Figure 6.
Digital colored transmission electron microscopy micrographs of the control group (A) and aflatoxin B1-treated group III (B,C). (A) Normal hepatocytes with a large round nucleus (N); cytoplasm contains the mitochondria (M), rER, and lysosomes (arrowheads); Ito cells (green color) surrounding the hepatocyte contain lipid droplets (L). (B) Hepatocytes (HC) demonstrated exaggerated amounts of vacuoles (V); microvilli (MV) on their surface; Ito cells (IT) with a significant increase in lipid droplets (Lp) that condense the nucleus (blue), and collagen bundles within the cell (arrowheads). Kupffer cells (KC) were observed within the sinusoids (s), which were surrounded by a thick layer of fibrous tissue (*). (C) Necrotic hepatocyte exhibiting vacuolation, karyolysis, plasma membrane rupture, and release of cellular contents (note the nucleus (N) and mitochondria (M)).

