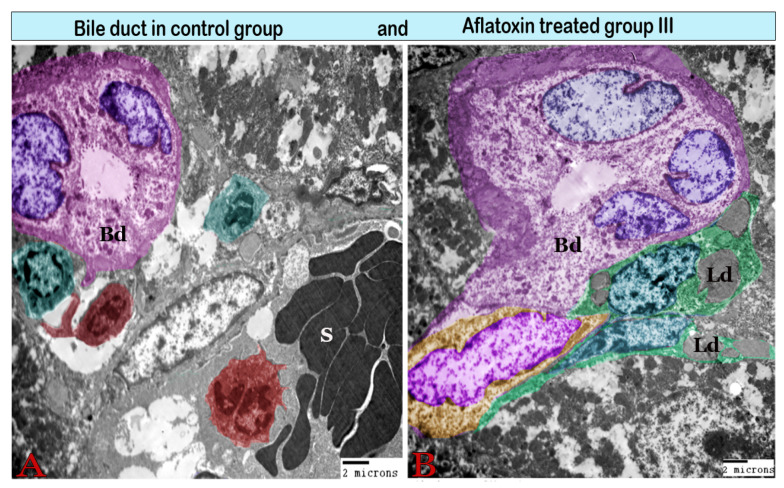
Figure 9.
Digital colored transmission electron microscopy micrographs of a cross section of a bile duct (Bd) from the control group (A) and aflatoxin B1-treated group III (B). (A) Normal interlobular bile duct surrounded by Kupffer cells (red) and pit cells (green); note the lumen (L) and bile duct epithelium (E). (B) Large interlobular bile duct encircled by a thick fibrous sheath. It is surrounded by Ito cells (green), which are loaded with large lipid droplets (Ld).

