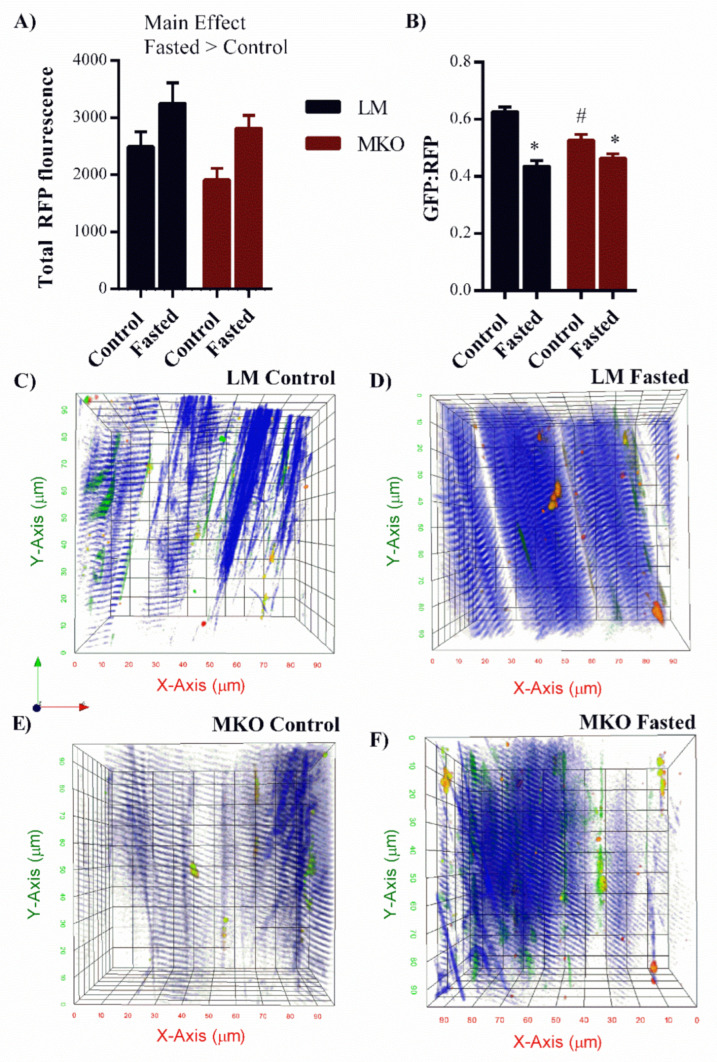
Figure 7.
Altered autophagy flux response to fasting in young Ulk1 MKO muscles. (A) Quantification of total red fluorescence intensity in fasted and control MKO and LM muscles (Main effect of fasting, p = 0.003). (B) Green:Red fluorescent protein ratio after fasting compared to control levels of autophagosome degradation in Ulk1 MKO and LM muscles, Significant interaction (p = 0.006) All data are presented as mean ± SEM * = significantly different from both control groups, # = significantly different from LM control. Representative two photon z-stack images taken from the TA muscle of (C) LM control, (D) LM fasted, (E) MKO Control, (F) MKO fasted mice. Green = LC3II incorporated into autophagosome membrane, Red = LC3II in cytosol, Blue = second harmonic generation labeling skeletal muscle contractile proteins for identifying muscle fiber location.

