Figure 8.
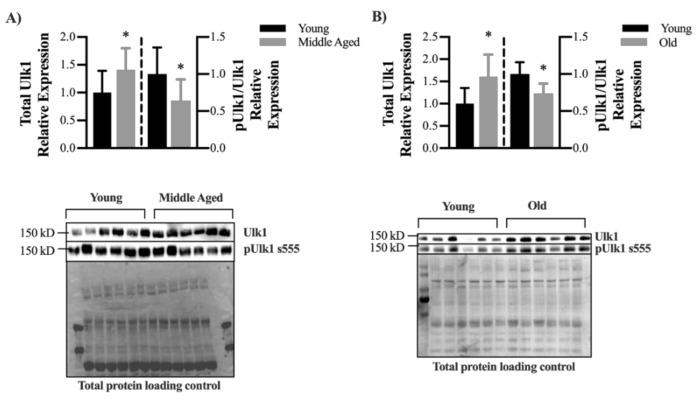
Decline in Ulk1 phosphorylation with age (A) Relative expression of total Ulk1 and pUlk1 normalized to Ulk1 in young (4 months) and middle-aged (16 months) mice and representative immunoblot images. Mean ± SD n = 7 mice. * = significantly different from young. (B) Relative expression of total Ulk1 and pUlk1 normalized to Ulk1 in young (20–40 y) and old (60–80 y) human muscle biopsy samples and representative immunoblot images. Mean ± SD n = 6 samples. * = significantly different from young. Bars on the left of the dashed lined correspond to the left y-axis, and bars on the right of the dashed line correspond to the right y-axis.

