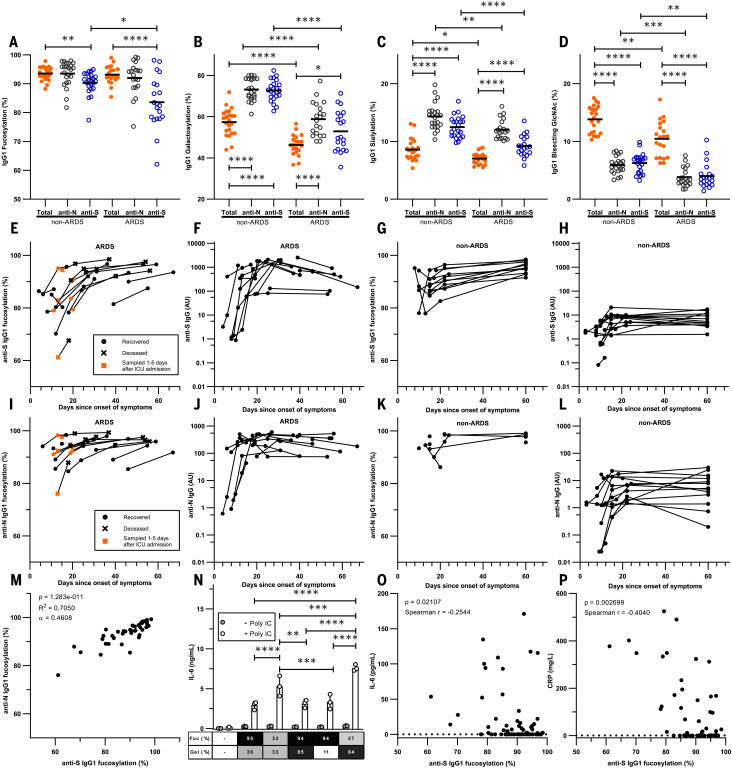
Fig. 3. Fc fucosylation levels of anti-S IgG1 are significantly decreased in critically ill COVID-19 patients.
(A) Fc fucosylation, (B) galactosylation, (C) sialylation, and (D) bisection degree of anti-S, anti-N, and total IgG1 from ARDS patients and non-ARDS donors clearing the infection asymptomatically or with mild symptoms from the initial screen. (E to L) Longitudinal IgG1-Fc fucosylation and IgG quantity for [(E) to (H)] anti-S and [(I) to (L)] anti-N in [(E), (F), (I), and (J)] ARDS patients and [(G), (H), (K), and (L)] non-ARDS cases. (M) Correlation between anti-N and anti-S IgG1-Fc fucosylation. (N) Representative examples of IL-6 release from macrophages triggered by FcγR through stimulation with glycoengineered IgG complexes with or without polyinosinic:polycytidylic acid [poly(I:C)]. (O) Correlation between plasma IL-6 concentrations and degrees of anti-S IgG1-Fc fucosylation. (P) Correlation between plasma CRP concentrations and degrees of anti-S IgG1-Fc fucosylation. Each circle represents a biological replicate: n = 20 for ARDS, n = 23 for non-ARDS [(A) to (D)], n = 17 and n = 14 for longitudinal ARDS and non-ARDS, respectively [(E) to (L)]. Examples of technical replicates for LC-MS data are shown in fig. S1C. [(F), (H), (J), and (L)] IgG data are representative ELISA values calibrated against a standard pool from two technical experiments. For all available paired data used in (M), n = 40. (N) IL-6 production by macrophages was measured with ELISA, with each dot (n = 3) representing a technical replicate. All six biological replicates are shown in fig. S13. CRP and IL-6 numbers were obtained from clinical parameters and IL-6 data by Meso Scale Discovery, using all available paired data [(O) n = 82 and (P) n = 53]. Statistical analyses were performed as a mixed-model two-way ANOVA with Bonferroni correction of post hoc t tests for comparing glycosylation traits and cytokine secretion between groups. Spearman’s correlations were performed in (O) and (P). To test the correlation between Fc fucosylation levels for anti-S and anti-N, a Pearson’s correlation was performed. Only statistically significant differences are shown. *P < 0.05, **P < 0.01, ***P < 0.001, ****P < 0.0001.

