Fig. 1.
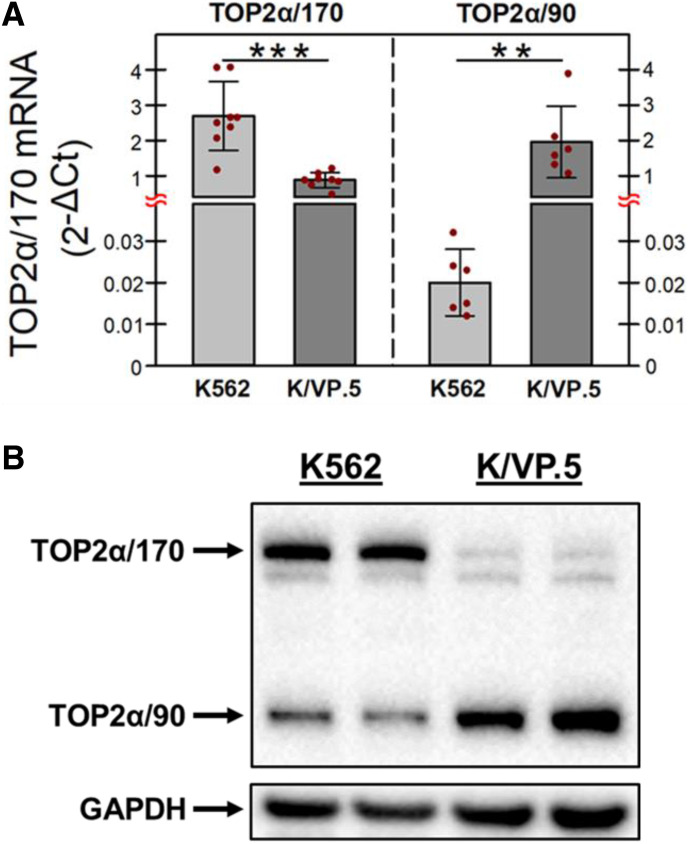
TOP2α/170 and TOP2α/90 mRNA and protein levels in K562 and drug-resistant K/VP.5 cells. (A) qPCR experiments were performed utilizing K562 and K/VP.5 cDNAs and a TaqMan hydrolysis assay specific for TOP2α/170 and TOP2α/90 mRNAs. Results shown are means ± S.D. from six or eight paired RNA/cDNA isolations/determinations performed on separate days; P < 0.001, comparing the differences in mean calculated 2−ΔCt values for K/VP.5 vs. K562 TOP2α/170 mRNA, 95% CI (1.17, 2.46); P = 0.005, comparing the differences in mean calculated 2−ΔCt values for K/VP.5 vs. K562 TOP2α/90 mRNA, 95% CI (0.87, 2.99). (B) Representative immunoassay using K562 and K/VP.5 cellular lysates. Blots were probed with antibodies specific for the N-terminal portion of TOP2α/170/90 (i.e., amino acids 14–27) or for GAPDH. **P < 0.01; ***P < 0.001.

