Fig. 3.
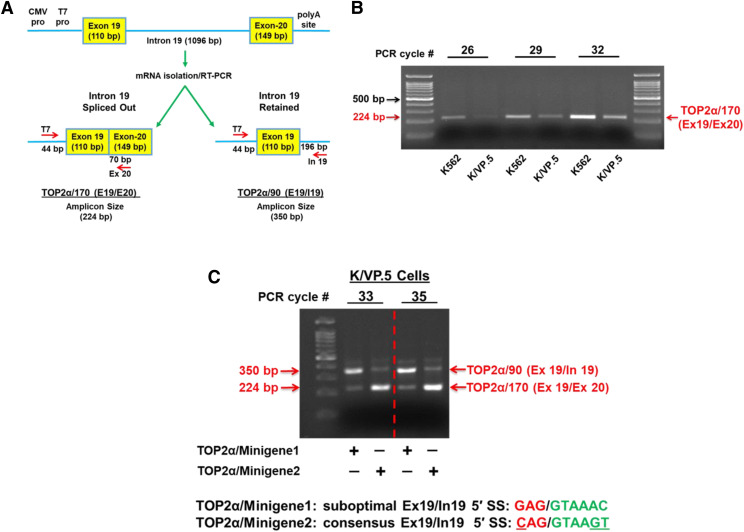
Effects of optimizing the weak TOP2α E19/I19 5′ SS harbored in a TOP2α minigene construct on TOP2α/170 mRNA expression in etoposide-resistant K/VP.5 cells. (A) Schematic representation of the TOP2α gene segment that was subcloned into the pcDNA3.1 expression plasmid. Minigene-expressed and processed TOP2α/170 (E19/E20; i.e., I19 spliced out) and TOP2α/90 (E19/I19; i.e., I19 retained) PCR amplicon sizes are shown. CMV, cytomegalovirus; polyA, XXXX; pro, promoter. (B) K562 and K/VP.5 cells were transfected with the TOP2α/Minigene1 construct (i.e., harboring the weak TOP2α E19/I19 5′ SS). RNA was isolated and reverse transcribed, and PCR experiments were performed. Ethidium bromide–stained agarose gel fractionated TOP2α/170 amplicons are denoted with the red arrow. The PCR cycle number is indicated to ensure the linear range of amplification and allows for the direct comparison of the intensity of the TOP2α/170 amplicon from K562 cells versus K/VP.5 cells. (C) K/VP.5 cells were cotransfected with TOP2α/Minigene1 and TOP2α/Minigene2 (i.e., harboring a consensus TOP2α E19/I19 5′ SS). RNA was isolated and reverse transcribed, and multiplex PCR experiments were performed. Ethidium bromide–stained agarose gel fractionated TOP2α/90 and TOP2α/170 amplicons are denoted. The PCR cycle number is indicated to ensure the linear range of amplification and allows for the direct comparison of the intensity of the TOP2α/90 and TOP2α/170 amplicon from K/VP.5 cells.

