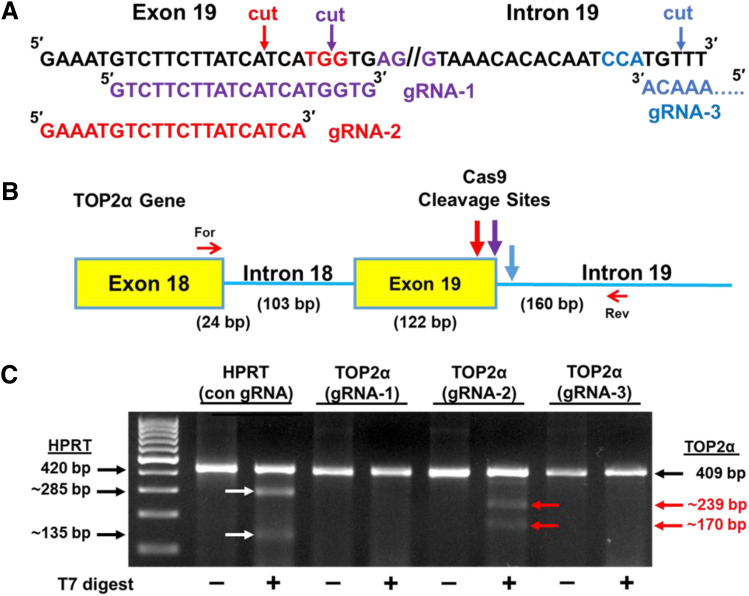
Fig. 4.
Effects of gRNA-2 on Cas9 cleavage at the TOP2α E19/I19 5′ boundary sequence. (A) Sequence of the TOP2α E19/I19 5′ boundary sequence is shown. Candidate PAM sites and corresponding gRNAs are color coded. Arrows denote where Cas9 will generate a DSB. (B) Schematic representation of the E18 through I19 region of the TOP2α gene. The large color-coded arrows denote sites where gRNA-directed Cas9 cleavage and NHEJ generation of indels can occur. The small red arrows denote the forward (For) and reverse (Rev) primers used for the GCD assay. (C) Ethidium bromide–stained agarose gel fractionated GCD PCR amplicons before and after treatment with T7 endonuclease I. The parental and T7 endonuclease I cleaved daughter PCR amplicons are indicated, and their respective sizes are denoted. A positive HPRT1 control (con) GCD assay is also shown.

