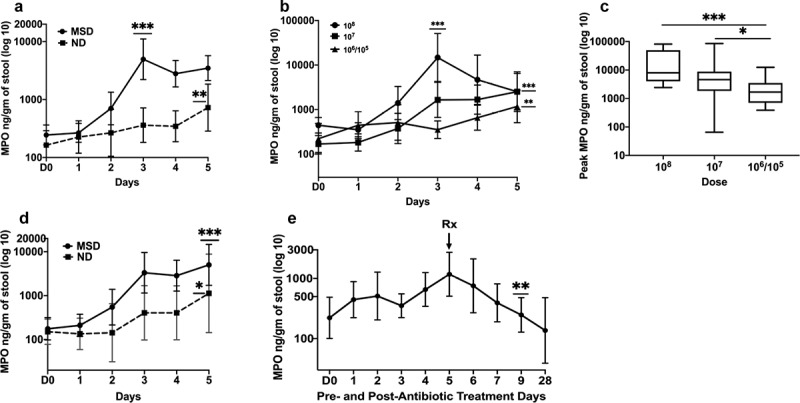
Figure 1.

MPO concentrations pre- and post ETEC challenge
A. Magnitudes and kinetics of MPO based on clinical outcome following ETEC challenge (all doses). B. Magnitudes and kinetics of MPO concentrations by dose. C. Comparison of the peak MPO concentrations on any day by dose. Doses: 108 or 107 or 106/105 CFU of ETEC. D. Comparison of magnitudes and kinetics of MPO concentrations by clinical outcome when challenged with the dose 107 CFU of ETEC. MSD: moderate to severe diarrhea; ND: no diarrhea; D0: day before challenge; 1 to 5: 1 to 5 days after challenge. E. Reduction of MPO concentrations after antibiotic treatment. Rx: Antibiotic treatment; D0: day before challenge; 1 to 28: 1 to 28 days after challenge with 106/107 dose. p values are for comparisons between baseline and the peak in Fig A, B and D; In Fig E, p values are for comparisons between pre- and post-antibiotic days. p < .05:*; p < .01:**, p < .001:**
