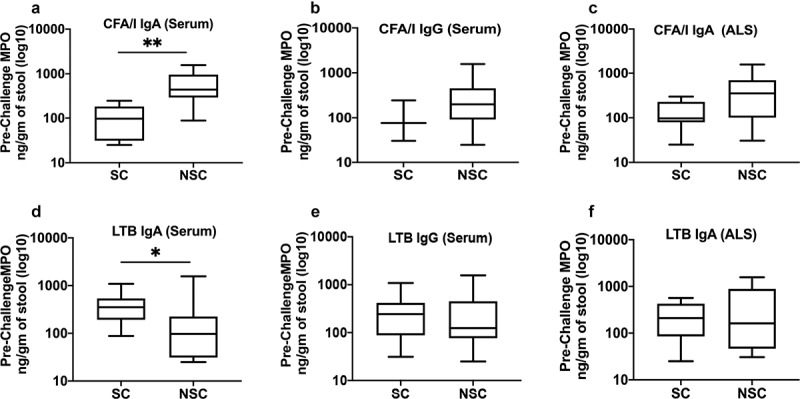
Figure 2.

Pre-challenge MPO concentration in the subjects who did versus who did not seroconverted following challenge. Upper panel CFA/I, lower panel LTB; A,D: serum IgA, B,E: Serum IgG; C,F: ALS IgA. SC: seroconverted, NSC: not seroconverted; Box plot showing Min, Max and Median. p < .05:*; p < .01:**
