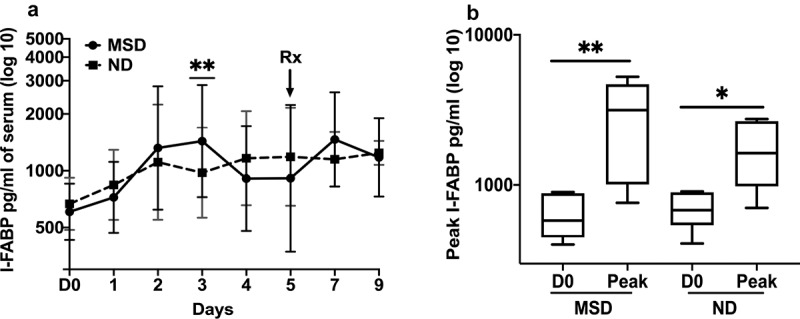
Figure 3.

I-FABP concentrations pre- and post ETEC challenge
A. Magnitudes and kinetics of MPO based on clinical outcome following ETEC challenge with 106/107 dose. MSD: moderate to severe diarrhea; ND: no diarrhea; D0: day before challenge; 1 to 9: 1 to 9 days after challenge. B. Comparison of the pre- and post-challenged peak I-FABP concentrations on any day by clinical outcome. D0: day before challenge; Peak: highest concentrations of MPO any day; MSD: moderate to severe diarrhea; ND: no diarrhea; Box plot showing Min, Max and Median. p < .05:*; p < .01:**. Rx: Antibiotic treatment.
