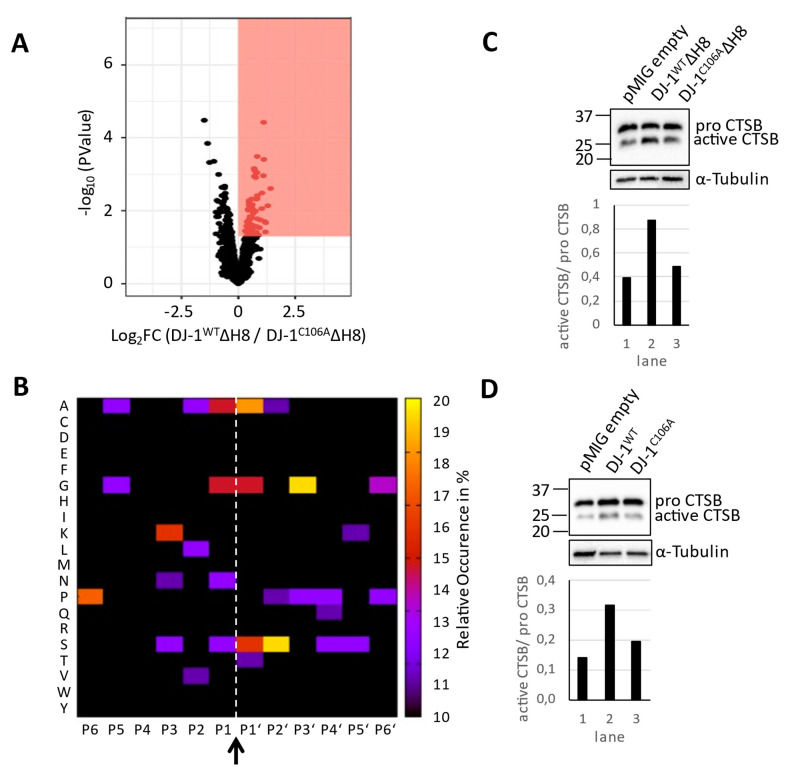
Figure 2.
Degradome analysis: (A) Volcano plot representation of the TAILS experiment of DJ-1WTΔH8 and DJ-1C106AΔH8 overexpressing cells following LIMMA analysis, red box: proteins with higher abundance in DJ-1WTΔH8 cells and plimma < 0.05 (B) Heatmap of the occurrence of amino acids in each position, P6-P6′, of peptides with higher abundance in DJ-1WTΔH8 cells following LIMMA analysis relative to the natural abundance levels of amino acids in humans (arrow and dashed line highlight the hydrolysis site, P1 to P6 were derived bioinformatically) (C,D) Cathepsin B (CTSB) Immunoblots with α-Tubulin as loading control (upper panels) and quantification of the amount of active CTSB (lower panels).

