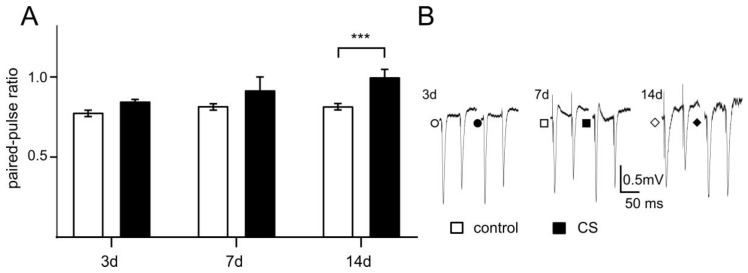
Figure 4.
The influence of CS on paired-pulse ratio (PPR) in recordings from FC slices. A—Comparison of PPR in CS 3d (n = 8) vs. control (n = 11); CS 7d (n = 19) vs. control (n = 19) and CS 14d (n = 19) vs. control (n = 9), respectively. B—Examples of individual FPs evoked by paired stimuli in slices from control (open shapes) and after CS stress (filled shapes). Shapes of symbols corresponding to appropriate animal groups (circles–3 days, squares–7 days, and diamonds–14 days of treatment). *** p < 0.0001 vs. control (post-hoc Sidak’s test).

