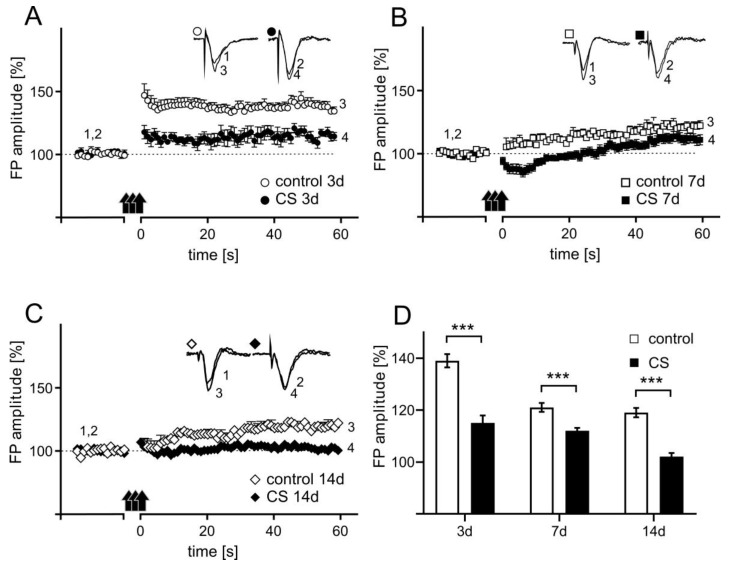
Figure 5.
Crowding stress-evoked decrease in LTP magnitude in the rat FC. Plots of the time course of FP amplitude (± SEM) before and after LTP induction showing the influence of CS on LTP after 3 days of CS (A) and after 7 (B) or 14 days of CS (C). The data are presented as group means ± SEM for controls (non-filled shapes) and different stress groups: 3 days (filled circles, n = 8), 7 days (filled squares, n = 19), and 14 days (filled diamonds, n = 18). Insets in A, B, and C show the superposition of averaged FPs recorded in representative experiments at the times indicated by numbers. Black arrows in A, B, and C denote the TBS. (D) Comparison of the CS-evoked changes LTP magnitude. Data calculated as a percentage of changes relative to baseline control values (100% indicated as a dashed line). *** p < 0.0001.

